Is This the "Suckers' Rally"?

It's great to see this morning's reading of the Consumer Price Index (CPI) come in at a lower than expected level.
The stock market is mildly cheering on the news, which is nice as far as these things go. But the idea that inflation is easing...is old news at this point.
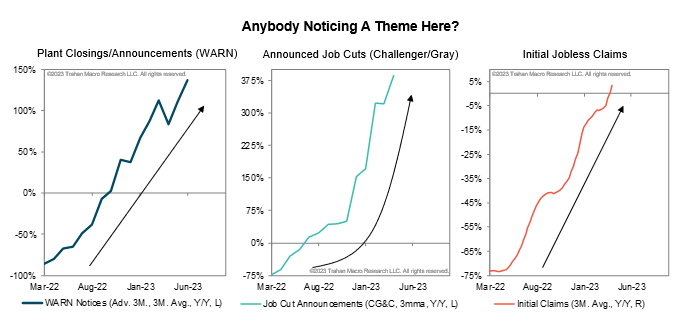
The new news (the stuff that the market has yet to discount into current prices, in my opinion) is the wave of layoffs and job cuts that are only starting to be felt in the economic statistics.
For example, the stock market was closed last Friday. So the latest US employment report (for March) was barely pondered by investors as we started this week. But the latest round of employment news is hardly comforting, as some on Twitter pointed out:
So what am I getting at? I'm pointing out a fundamental truth of investing and trading....
Bear markets are treacherous.
I say this over and over again to myself - and to you - because you have to go through a bear market previously to really understand how many ways it can part you from your wealth and self-confidence.
I can remember numerous times during the 2000-2003 bear market, and the 2007-2009 bear market that felt exactly like now.
It's a classic trap. First, the indexes move higher, giving hope that the worst is over. Then things go sort of quiet. The S&P 500, DJIA and Nasdaq trade in a narrow range - not going up much, but not going down either.
In a bull market, that's a recipe for a market that wants to keep going up. And as the indexes linger, you can just feel the market wants to explode higher.
Except it doesn't.
Instead, a trap door opens. And down we go again.
As I'm fond of saying, I'm no perma-bear. I want to buy and speculate in stocks. I try to always have something working in the portfolio. But I've laid out important reasons to be very suspicious of the current rally.
So here's another...
Analogs, Analogs
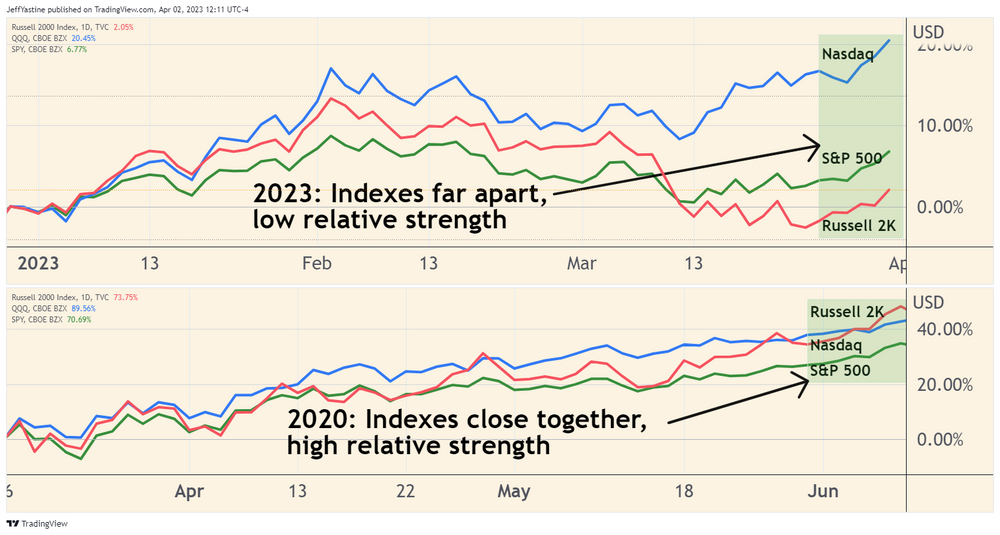
In recent posts, I've pointed out the weirdness of today's indexes...
The weirdness is that among all the major indexes, only the Nasdaq has "broken out" to new near-term highs.
For instance, here's what the Nasdaq (QQQ)'s chart looks like compared to the S&P 500. See the difference?
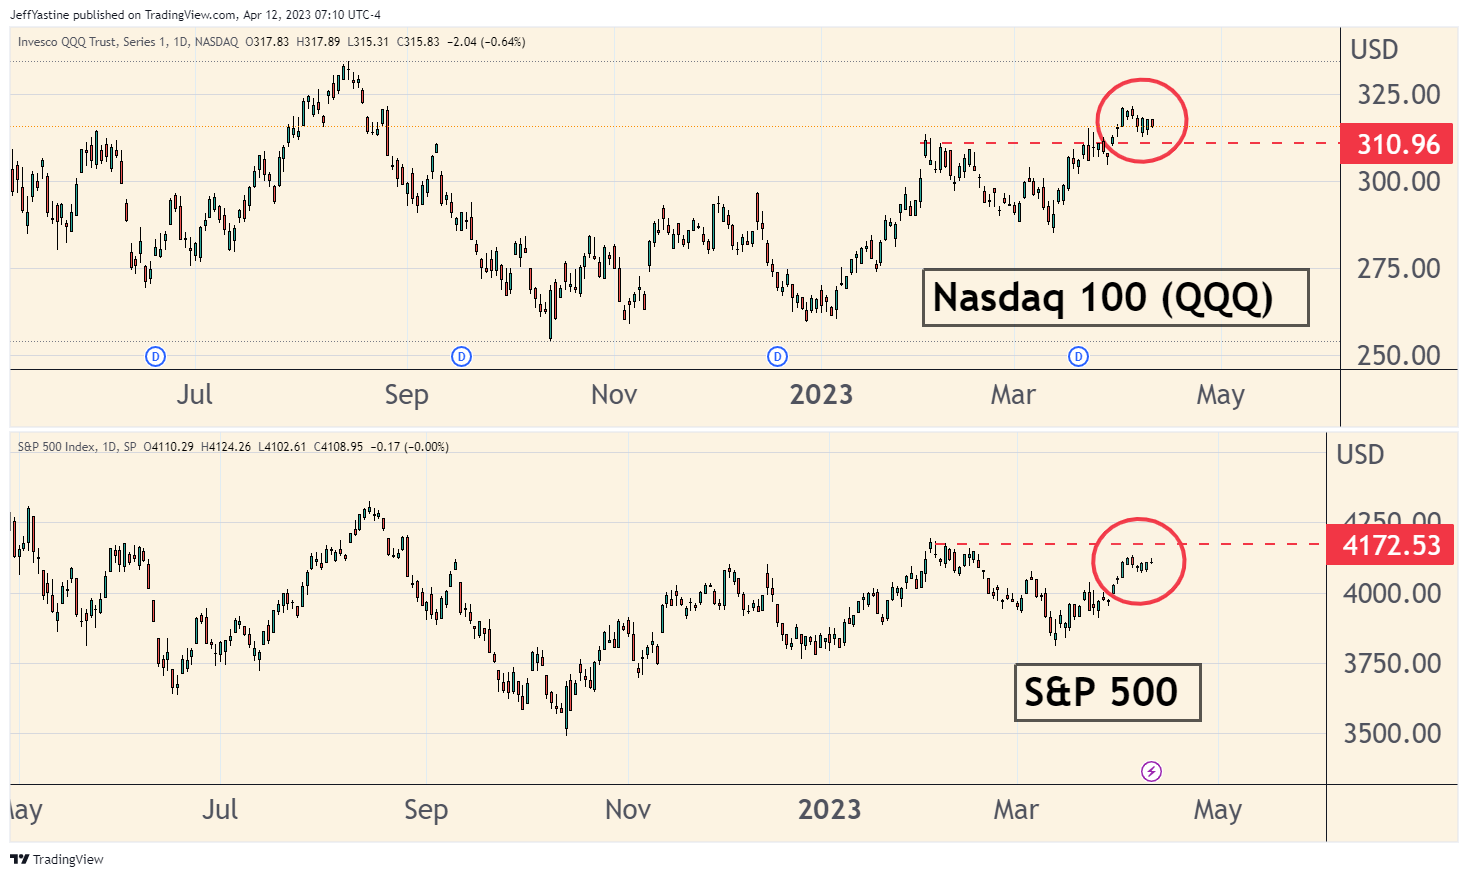
One index made a new high. The other has not (so far). The discrepancies are even bigger when comparing the Nasdaq to the Russell 2000 small-cap index.
These seem like small, easily dismissed differences.
Yet navigating the stock market is like playing a hand of poker with a wily opponent.
Some players have "tells" - little clues that give them away. Sometimes you have to observe closely - maybe the other player is breathing a little faster, or tapping a finger with nervous energy - to sense whether he might be bluffing.
So I was curious whether we've ever seen a similar bear market period where one index appears strong and the rest are weak.
So I went looking for "analogs" - charts where market periods of the past look like the current chart of the market.
Here's the amazing thing... back in early 2002 - in the middle of the devastating 2000-2003 bear market - we saw exactly the same thing with the Dow Jones Industrial Average.
The chart below explains what I mean. In March/April of 2002, the DJIA hit a new near-term high (getting above the red dotted line). The S&P 500 and other indexes failed to do the same:
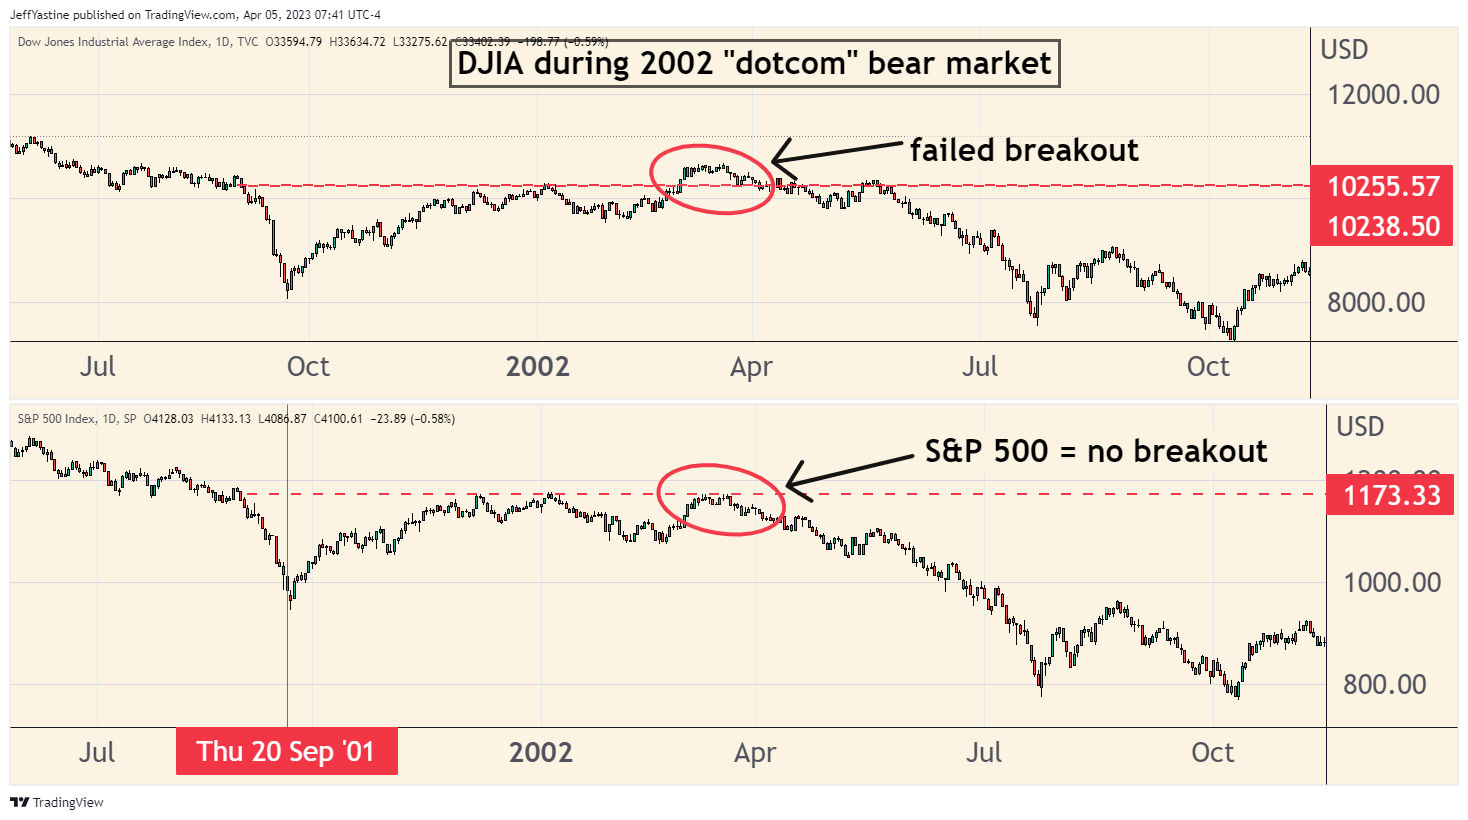
That turned out to be the poker game equivalent of a "tell."
New bull market? That was a bluff. Bullish investors bought into that early 2002 rally thinking it was the real deal. Instead, it was a set-up.
Afterward, the Nasdaq lost 50%, and the S&P 500 fell 35% in six months.
Comparing 2002 to Now
So if we match up the DJIA's chart in 2002 and compare it to the Nasdaq index today, this is what it looks like:
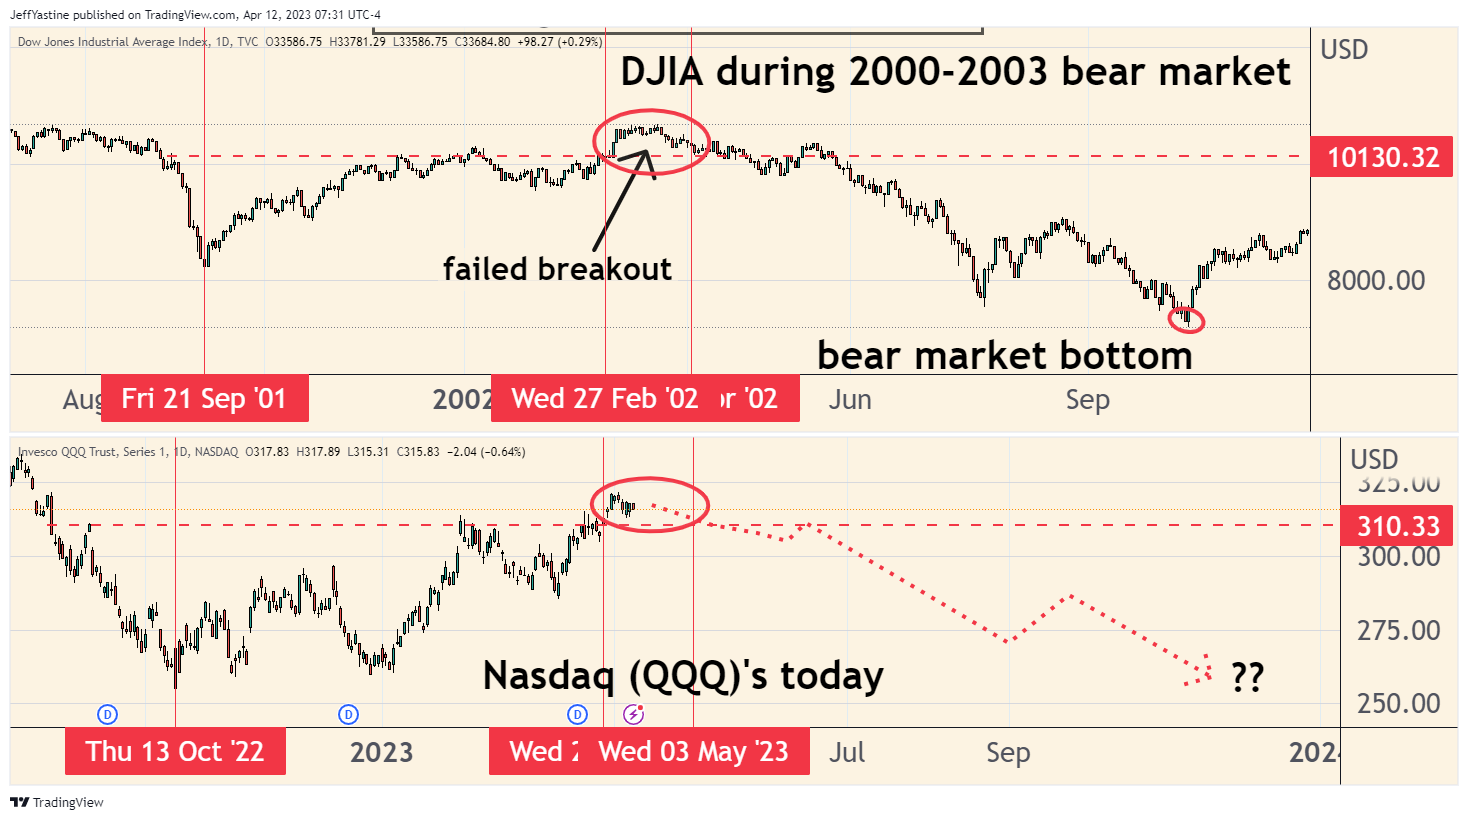
The similarities are uncanny.
- As mentioned, the DJIA was the only index in Feb/March 2002 to mount a new near-term high. The Nasdaq QQQ's are the only index to do the same now.
- The 2002 DJIA rally peaked after 111 trading sessions. The current Nasdaq rally may have peaked after 116 trading sessions.
- In 2002, the DJIA rally rose 29% from the lows to the highs. The current Nasdaq rally may have peaked after a rise of approximately 25%.
I have to say of course that there are no guarantees. I could be wildly wrong. If I am, I'll be the first to say so. And I'll be out chasing after stocks like everyone else.
But if the analog keeps working, I would expect that we'll continue to see the market "hover" in the current range, with occasional mini-rallies and little selloffs to keep everyone guessing.
If I'm right, we could see the next downturn start sometime next week or the week after.
I'll keep monitoring this to see if this particular analog continues to prove itself accurate (or not).
Best of goodBUYs,
Jeff Yastine
Member discussion