Chart of the Week: Will our "Analog" Keep Playing Out?

Today should be very interesting indeed, when the Fed announces its latest decision on interest rates at 2pm ET, and then its chairman Jay Powell will add his color commentary on that decision in a 2:30pm ET press conference.
"Fed days" can either have lots of intraday volatility - or be incredibly boring.
Mainly, I just want to show you an updated "analog" comparison chart - the same one I've been showing you since early this month - showing the Nasdaq in 2007 versus the Nasdaq today:
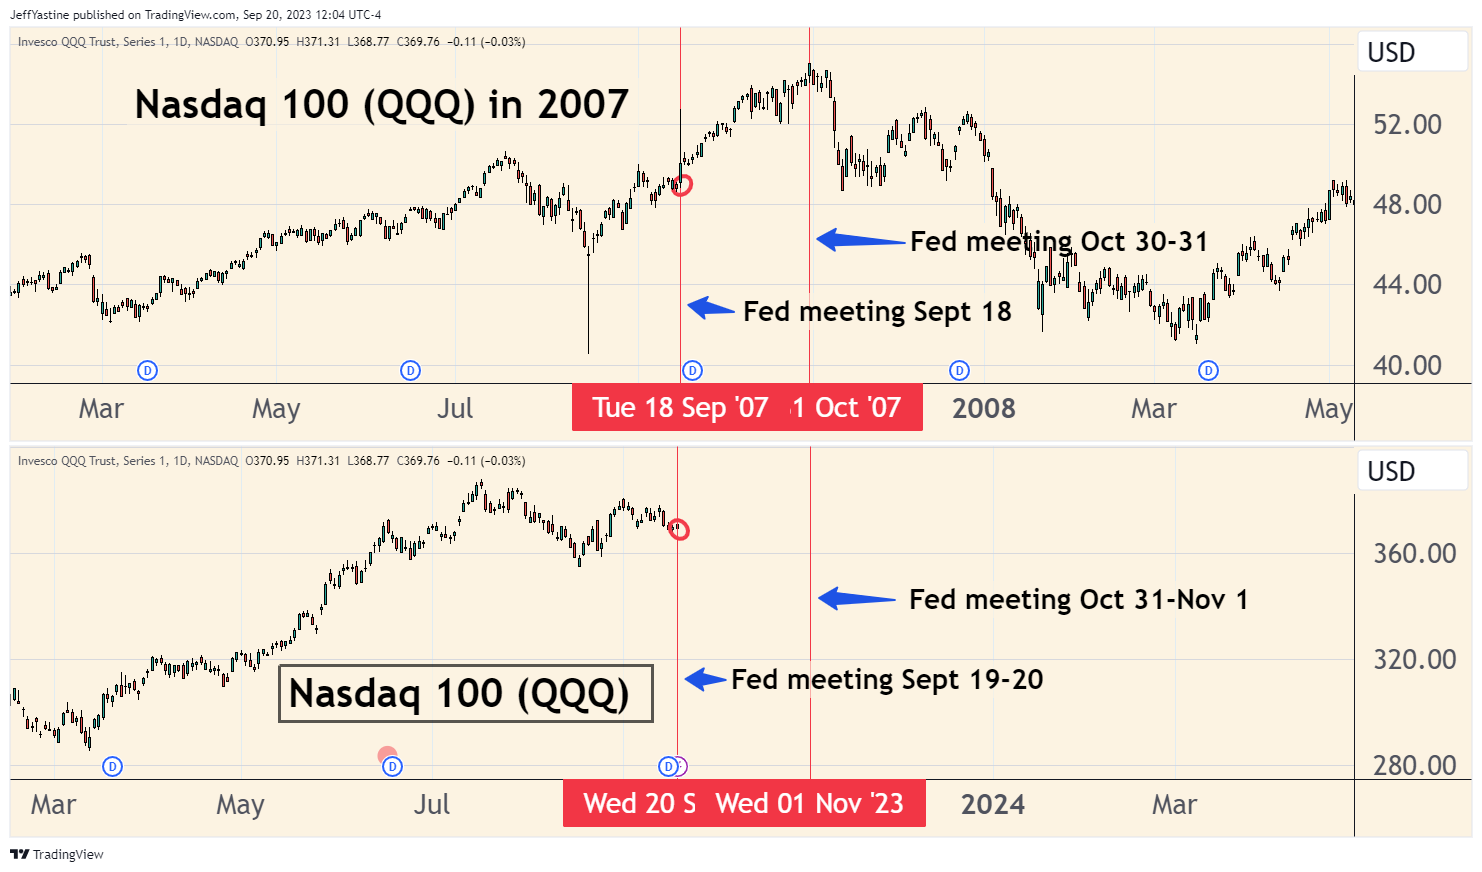
As you can see from the chart above, the market is still tracking closely to how it went in 2007.
That's why my expectations in recent weeks - and today - remain that the market will keep working its way higher over the next 6 weeks. But as I keep warning, I wouldn't want to overstay my bullish welcome beyond the end of October.
Is any of this guaranteed? Of course not. For all I know, whatever announcement that emerges from the Fed today will spark a massive selloff that completely "breaks" the 2007 comparison shown above.
On the other hand, one thing I've learned (often the hard way) over the years is that strong bull markets do not die easily.
And it's not uncommon for market history to repeat, "echo" or "rhyme" from other periods in the past, simply because human behavior, reactions, and emotions tend to repeat as well.
So it will be very interesting indeed to see how stocks respond once all the Fed news is out of the way.
Best of goodBUYs
Jeff Yastine
Member discussion