Stocks' Roadmap: New Bull Market?

There's no denying Wall Street had a good week...
- Nasdaq 100: +3%
- S&P 500: +3.3%
- DJIA: +3%
- Russell 2000: +3.7%
Most of those gains occurred Wednesday, Thursday, and especially Friday. It was powerful stuff, too - a series of impulse moves. Each day the market opened sharply higher than the day before, and never revisited the prior day's lows.
So let's not forget what I wrote early Wednesday morning, in an otherwise market-cautionary note to all of you:
"For all I know, the train is about to leave the station (though I doubt it). If all the major indexes suddenly improved in dramatic fashion, I'd change my tune."
Clearly all the indexes did improve in dramatic fashion.
So.... am I now learning how to sing "Happy Days are Here Again"?
The short answer is....no. Read on for the reasons.
But I'd change my tune if last week's rally didn't occur with 2 of the 3 factors I wrote about in my Wednesday article "What They Don't Teach You at "Trading School."
Factor #1: "End of the quarter" periods often see "manufactured" rallies. Friday was the end of the year's first quarter.
Factor #2: Major "options expiration periods" often see "manufactured" counter-trend rallies. Friday was a major "options expiration" period.
Factor #3: The lead-up to major holidays is sometimes (though not always) bullish.
With factor #3, there are no "days-off" holidays coming up soon. But this Wednesday starts Passover. Next Sunday is Easter. And the major Muslim religious period of Ramadan started on March 22nd (and continues through most of April).
So it wouldn't surprise me to see the market hold its own or move higher, at least over the coming week or perhaps a little longer.
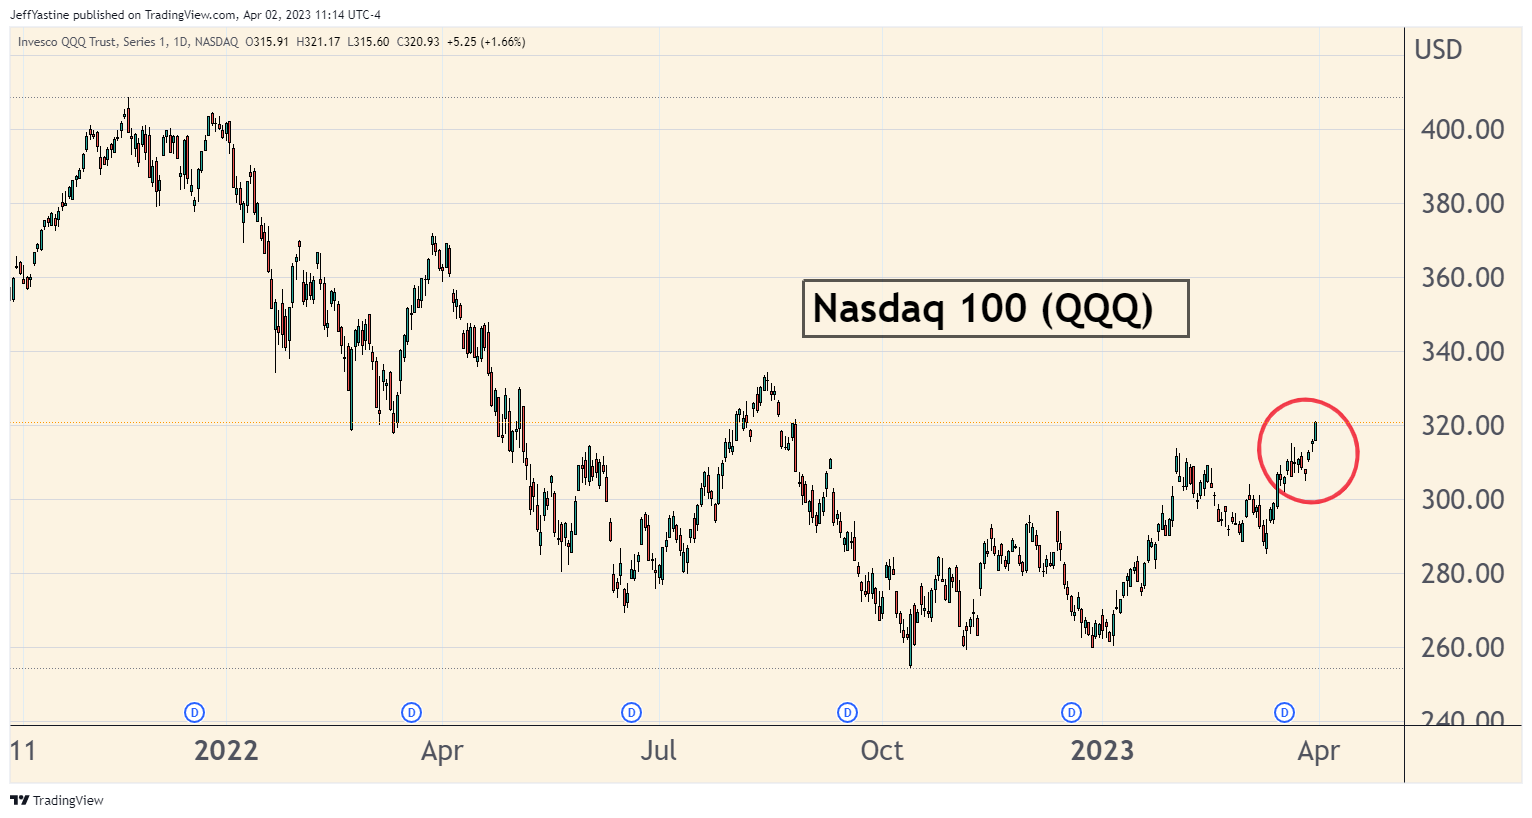
New Bull Market?
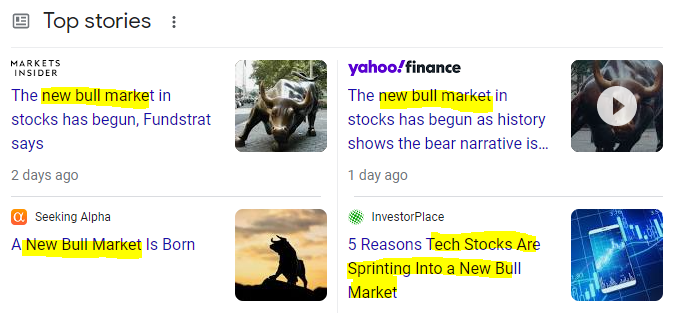
Certainly, a lot of folks are starting to think we're into a new bull market. Search for those 3 words on Google and you get this:
The general idea is that the major indexes completed a bottoming pattern at the end of the year (with the S&P 500 hitting its major low in October, and the Nasdaq and Russell 2000 completing their bottoms at the end of December).
But there's still something about this advance that I just don't like.
For an example, look at the chart below.
The relative strength of the major indexes to each other looks nothing like the first 3 months of 2020's new pandemic-inspired bull market:
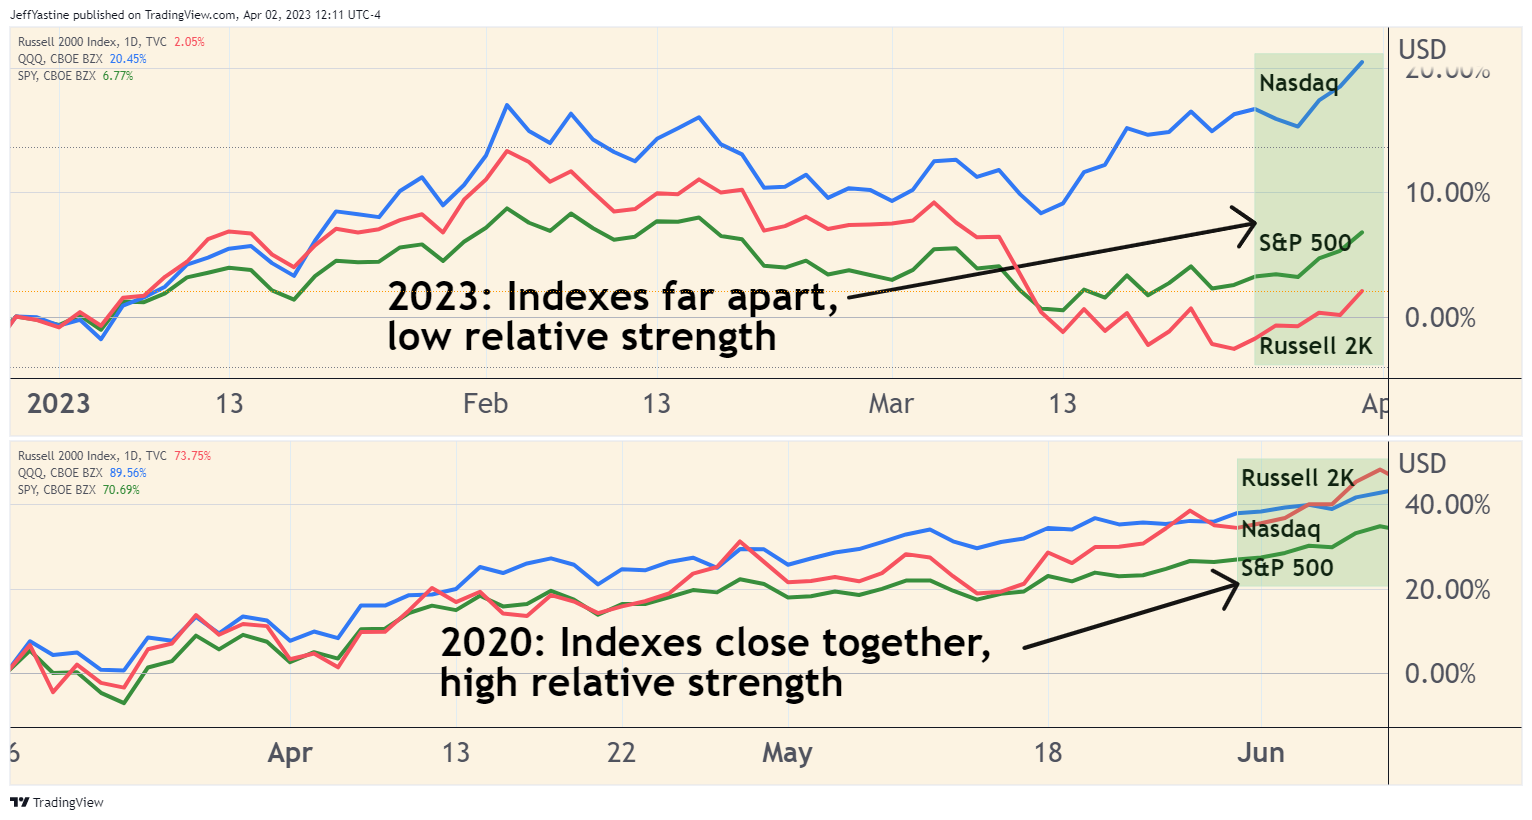
Notice the difference between the 2 panes above?
Here in 2023, the indexes are far apart. But in 2020, all 3 of the same indexes were ripping higher nearly in lockstep.
Let's compare today to 2009, when the last major bull market cycle began:
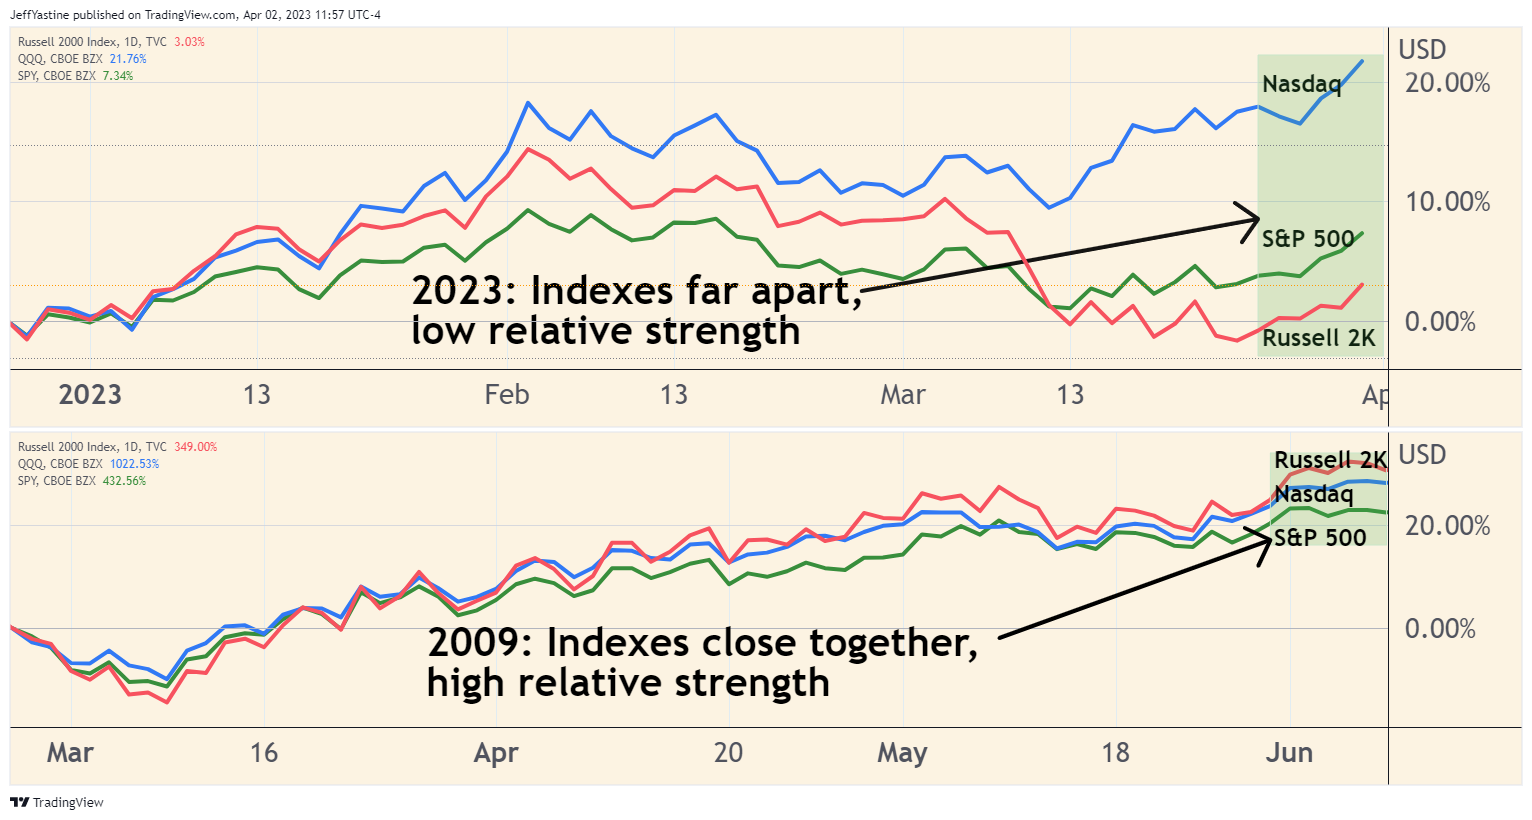
And let's look at 2003, which marked the bottom of the "dotcom" bear market:
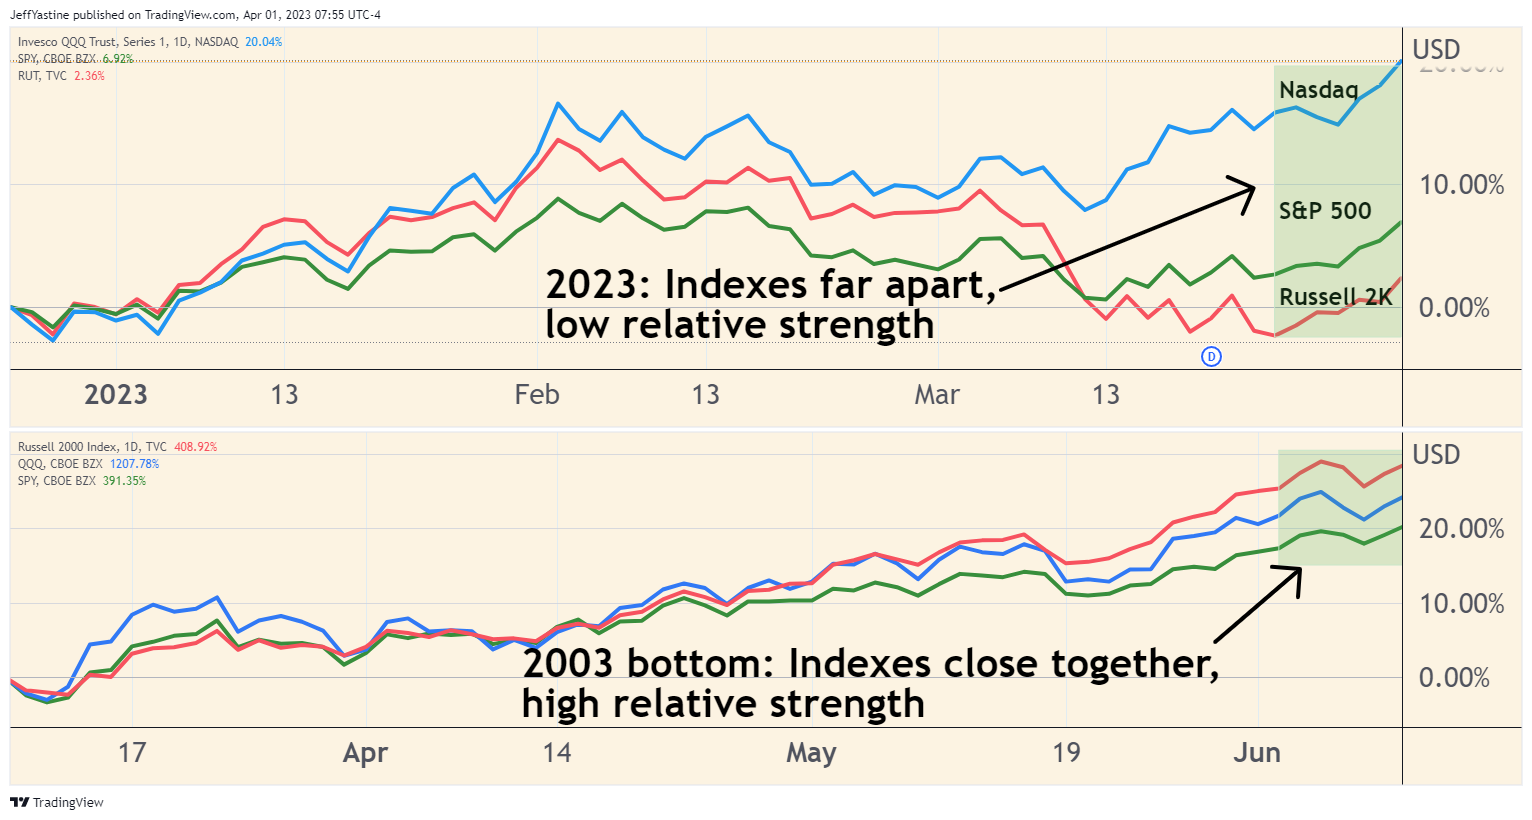
In 2003, it was the same story. All 3 indexes were closely mirroring each other as they advanced higher. But in our own time of 2023? Not so much.
And there's a technical answer to what's hinted at in the charts above about our "new bull market" of 2023...
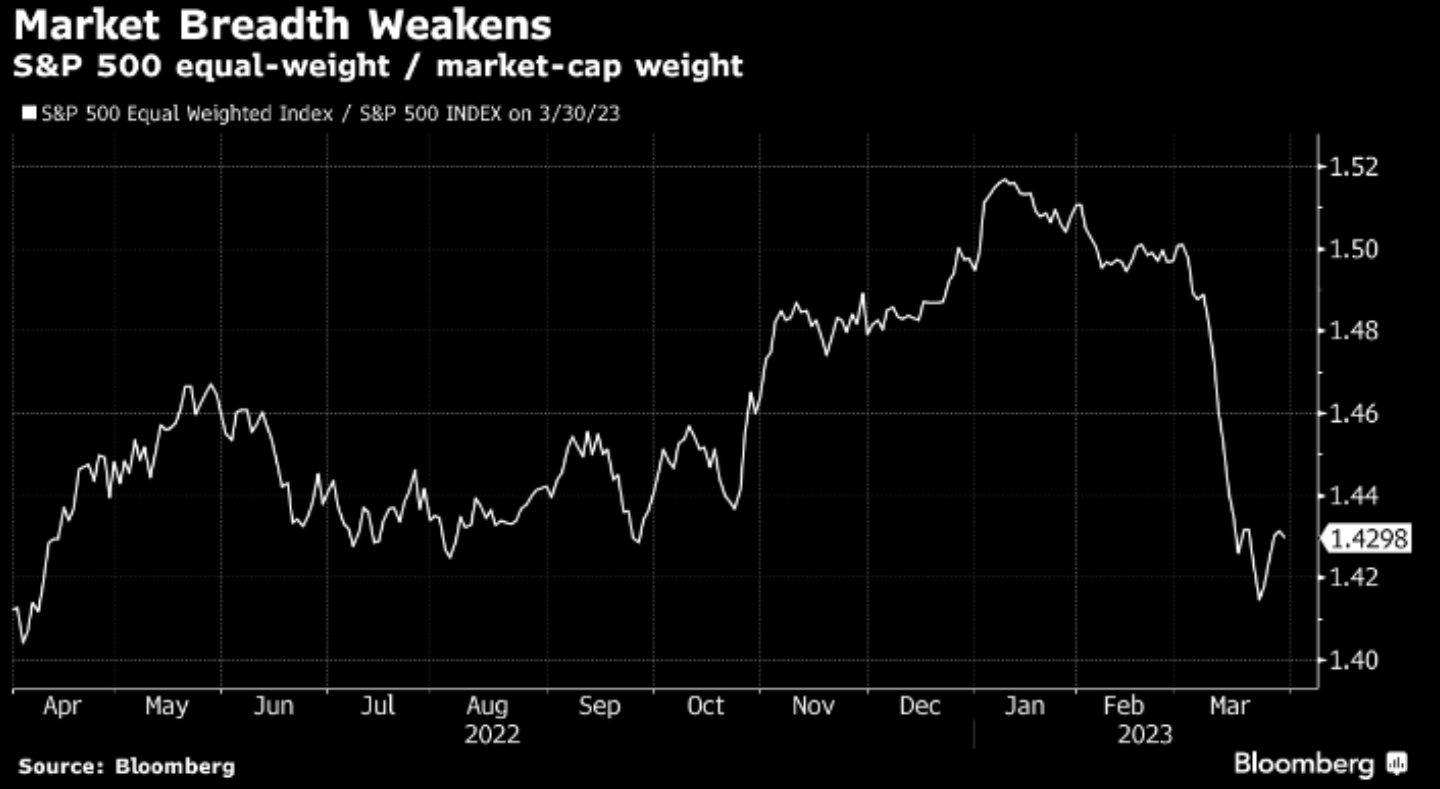
Terrible, terrible market breadth.
Market Breadth: Canary in the Coalmine?
"Market breadth" is just a fancy way of saying that a diverse group of stock sectors, are all going up at the same time.
In new bull markets, market breadth is typically very strong. But right now, it's pretty weak when you look at technical measurements of it like this chart:
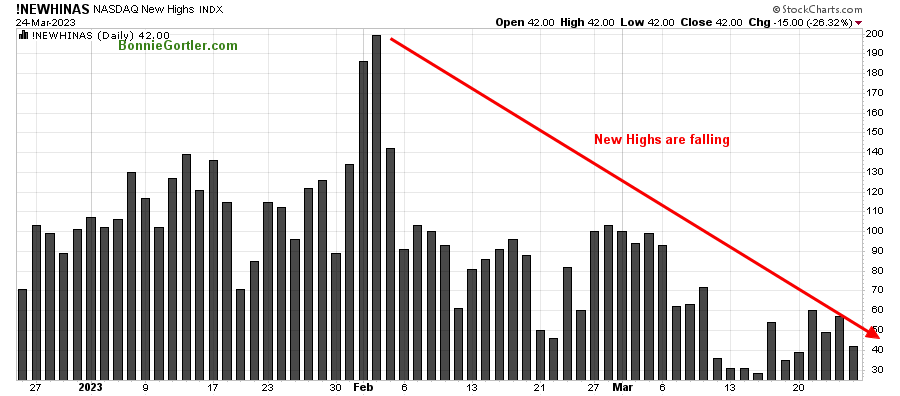
It's the same story when we look at "new highs" for the Nasdaq.
In a new bull market advance, bunches of stocks attract buyers. Soon enough, those stocks hit new highs for the week, then new monthly highs, and so on.
But this chart paints a very different story:
So what's the bottom line?
My interpretation is this:
The two charts above tell us most stocks aren't being pushed higher by eager new buyers.
Instead, they're being pulled higher, like boxcars in a long freight train - with a handful of major stocks like Tesla, Meta, Apple and Microsoft acting as the "locomotive" so to speak.
Keep in mind, despite the current conditions noted in the chart - nothing says that market breadth can't improve from bad to fair, and fair to good over time.
Sometimes after a sharp correction or deep selloff, lots of stocks remain in a "state of shock" so to speak. As investors gain confidence, the laggards begin to perk up. Market breadth improves.
But the charts above tell us that this is not yet a healthy market environment.
I suspect the bigger test of the strength of our "new bull market" will occur once we get past the major religious holidays of the coming week.
Best of GoodBUYs,
Jeff Yastine
Member discussion