Can We Call this a Bubble?

I don't know how many times I've heard someone call a market trend a bubble...but it happens a lot. I guess it's human nature - anytime something happens in the markets that we don't understand or disagree with, the default reaction is "it must be a bubble."
For that reason, I only rarely use the word. On the other hand, when things start getting crazy...well, it's not a bad idea to step back and consider the possibility.
So can we call this a bubble?
In my opinion - yeah, we are running into dangerous territory. It's dangerous because we tend to toss caution to the wind in bubble-type rallies. And when a bubble starts to deflate in earnest, it takes down everything with it.
From an interesting anecdotal perspective, the darling of the 2000 dot-com bubble was Cisco Systems (CSCO). And in our current market era, Nvidia (NVDA) is definitely the current darling.
And both are up by similar amounts of +600% in the past 18 months:
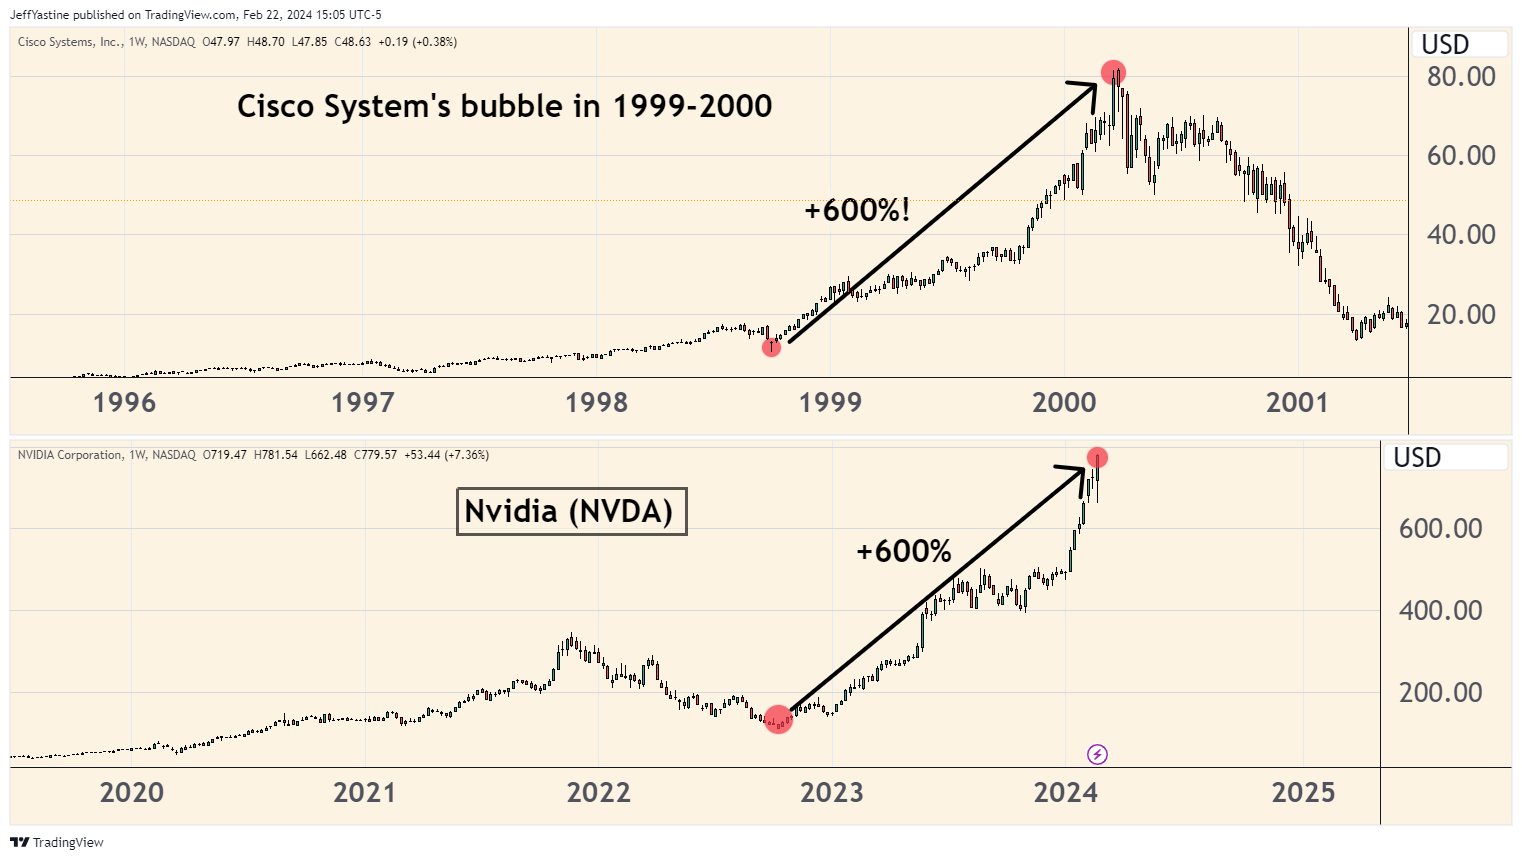
I was around during the dot-com era. What I remember most in the wake of Cisco System's crash was that the company's news was still good - even as the stock started to decline in a big way in the second of 2000.
It was only months later that the bad news became evident. Lots of Cisco's corporate customers had ordered too many routers. They misjudged demand, and as an economic recession unfolded, cut back their orders even further. Basically it was the same story, writ large, across much of the tech sector back then.
That's another reason why bubbles are dangerous. The "why" behind a stock's incredible rise in price still makes lots of sense. Few realize that stocks move in anticipation of future events, both good and bad.
There's also some interesting analog evidence.
In technical analysis circles, an "analog" is a comparison between 2 charts that have similar characteristics - in this case, a relentless bubble-like uptrend with only a few pullbacks, and violent leaps in price at every opportunity.
So the chart below compares the Nasdaq's QQQ ETF (which measures the pricing performance of the exchange's top-100 stocks) against the same QQQ ETF from the 1999-2000 dot-com bubble era:
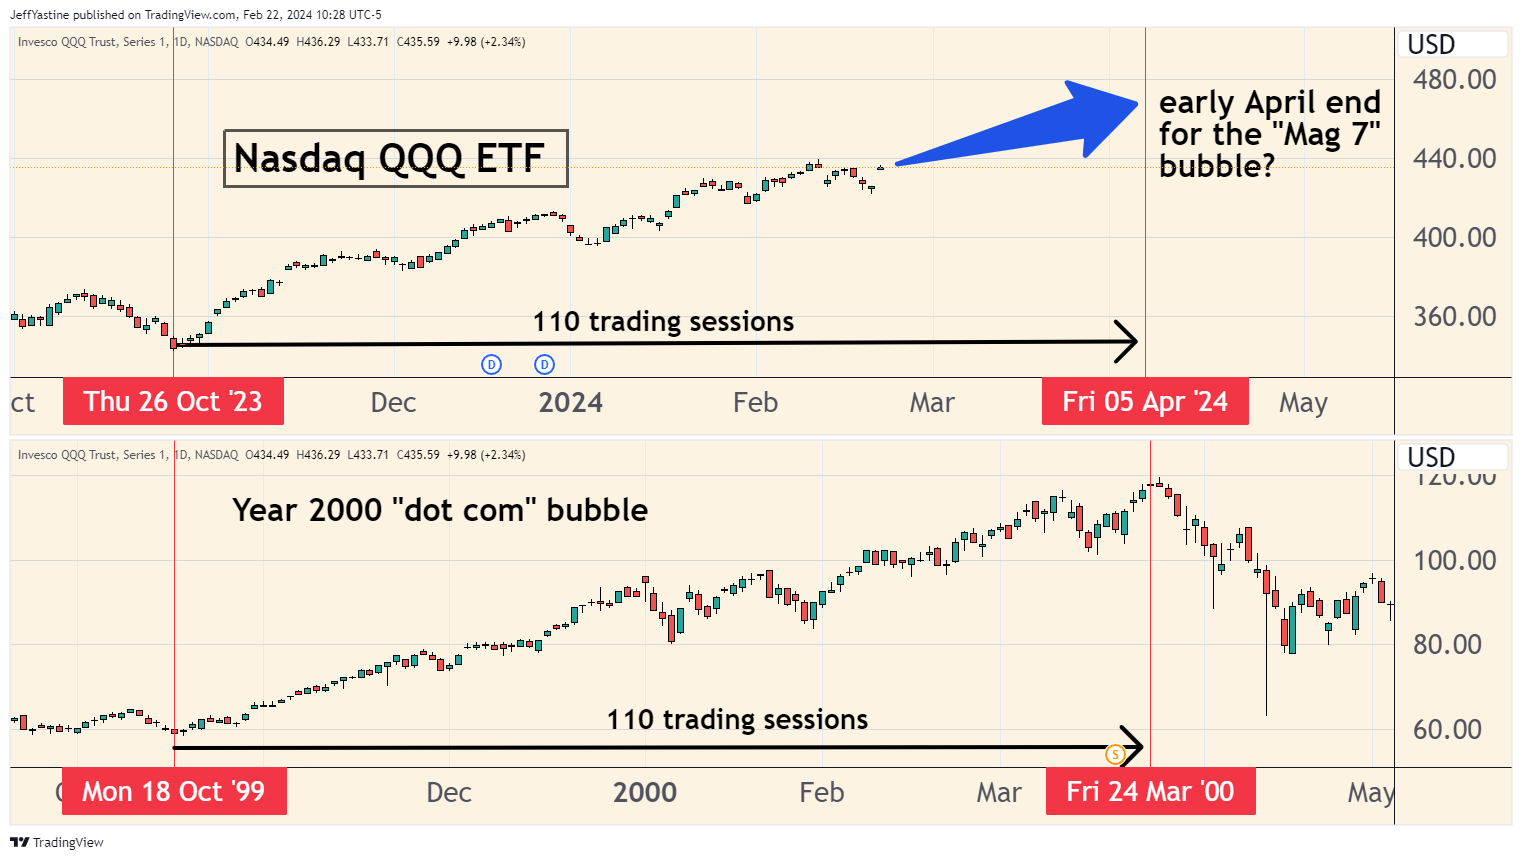
If this analog were to work out perfectly, as presented, then we're looking at a bubble top somewhere in late March or early April.
Of course, like all things having to do with stocks and the stock market, analog comparisons like the one above only work some of the time. I've presented my share of bearish (and bullish) analogs that did not play out the way I thought, or in the timeframe I expected.
On the other hand, let's say I was driving on Germany's high-speed Autobahn...
A "tire pressure warning" light would be helpful. Maybe the warning is false. Or maybe I have a big roofing nail stuck in my treads that's about to give me a blowout.
Either way, I'd sure like to know.
Best of goodBUYs,
Jeff Yastine
Member discussion