Can a Chart Save Your (Financial) Life?

The markets - both stocks and crypto - continue to flap around in the wind, so to speak. The major indexes today - Thursday, February 23rd - are all down a half-percent or so, doing a slow fade to nowhere for the time being...
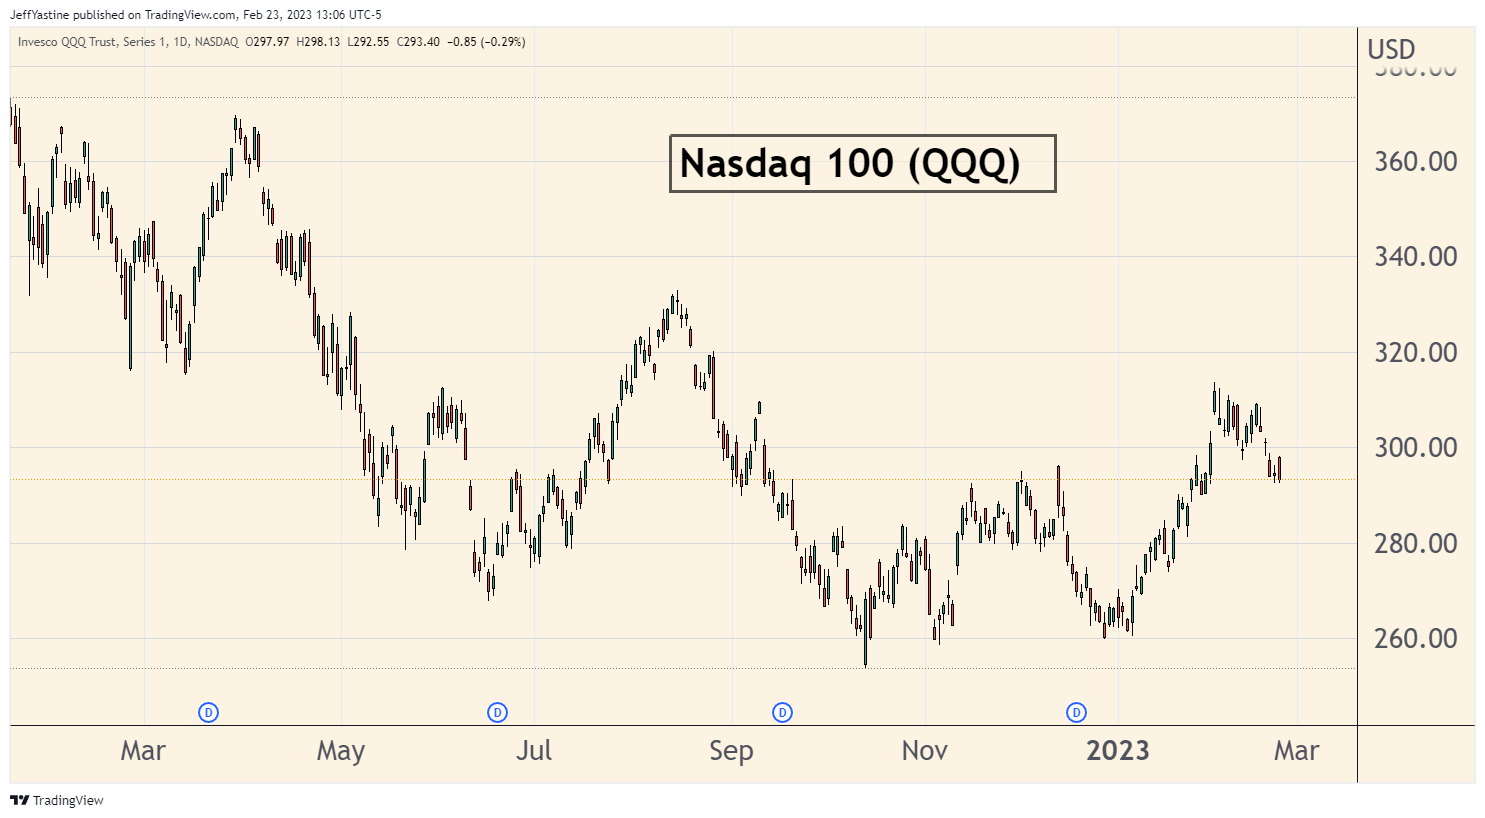
But I would continue to be very careful in the current market environment.
It's far too easy to get caught up in expecting this- or that- to happen, and then once committed with a bet that's too large...all it really does is trap us into "holding and hoping" that a favorite stock, ETF (or crypto) moves higher eventually.
So when it comes to this kind of analysis, I'm kind of a weirdo. I mean, in the financial world, you're supposed to be either...
- A "fundamental" guy, where profits, revenue, and balance sheet info tell you everything you need to know.
- A "technical" guy, where staring at a bunch of lines on a chart...tells you everything you need to know.
The arguments rage back-and-forth on Twitter about the validity of one versus another.
But I use both.
Charts vs Fundamentals
The way I see it, fundamental analysis and technical analysis are both tools in a toolbox.
To achieve our task - making money (and not losing lots of money in subsequent bear markets), sometimes we need a hammer. Other times we need a screwdriver. They're both very useful.
With that in mind, here's a technical analysis chart that saved the day for a lot of Bitcoin (BTC) fans when I posted it last May, when the crypto was around 30,000.
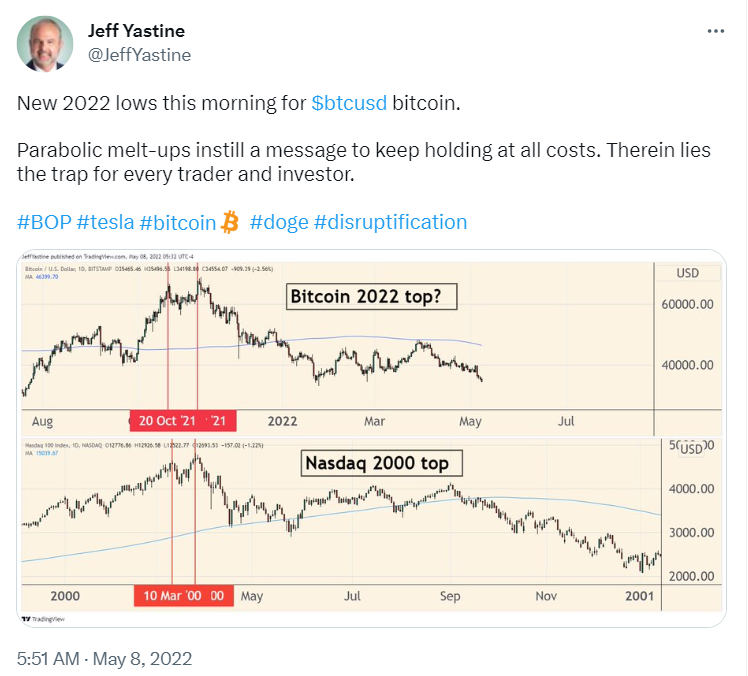
Today, Bitcoin is around 30% lower, to a recent 23,833.
But lately, I've started getting inquiries once again - maybe this is a good time to buy Bitcoin after the big rally of late?
I hate to be a killjoy, but in my personal opinion, I would stay far away from most speculative assets, especially Bitcoin. And if I just had to make a bet, I'd keep it very limited so that if I'm wrong, the damage to my investing/trading portfolio is recoverable.
With the Federal Reserve still appearing set on raising interest rates at least a bit higher (or maybe a lot higher), the monetary winds are blowing in the wrong direction for a big recovery in Bitcoin (or stocks).
And as the updated chart below shows...there could still be a lot of slow-motion pain ahead for Bitcoin, the same way that most stocks may be subjected to a long, slow months-long decline if we're not careful.
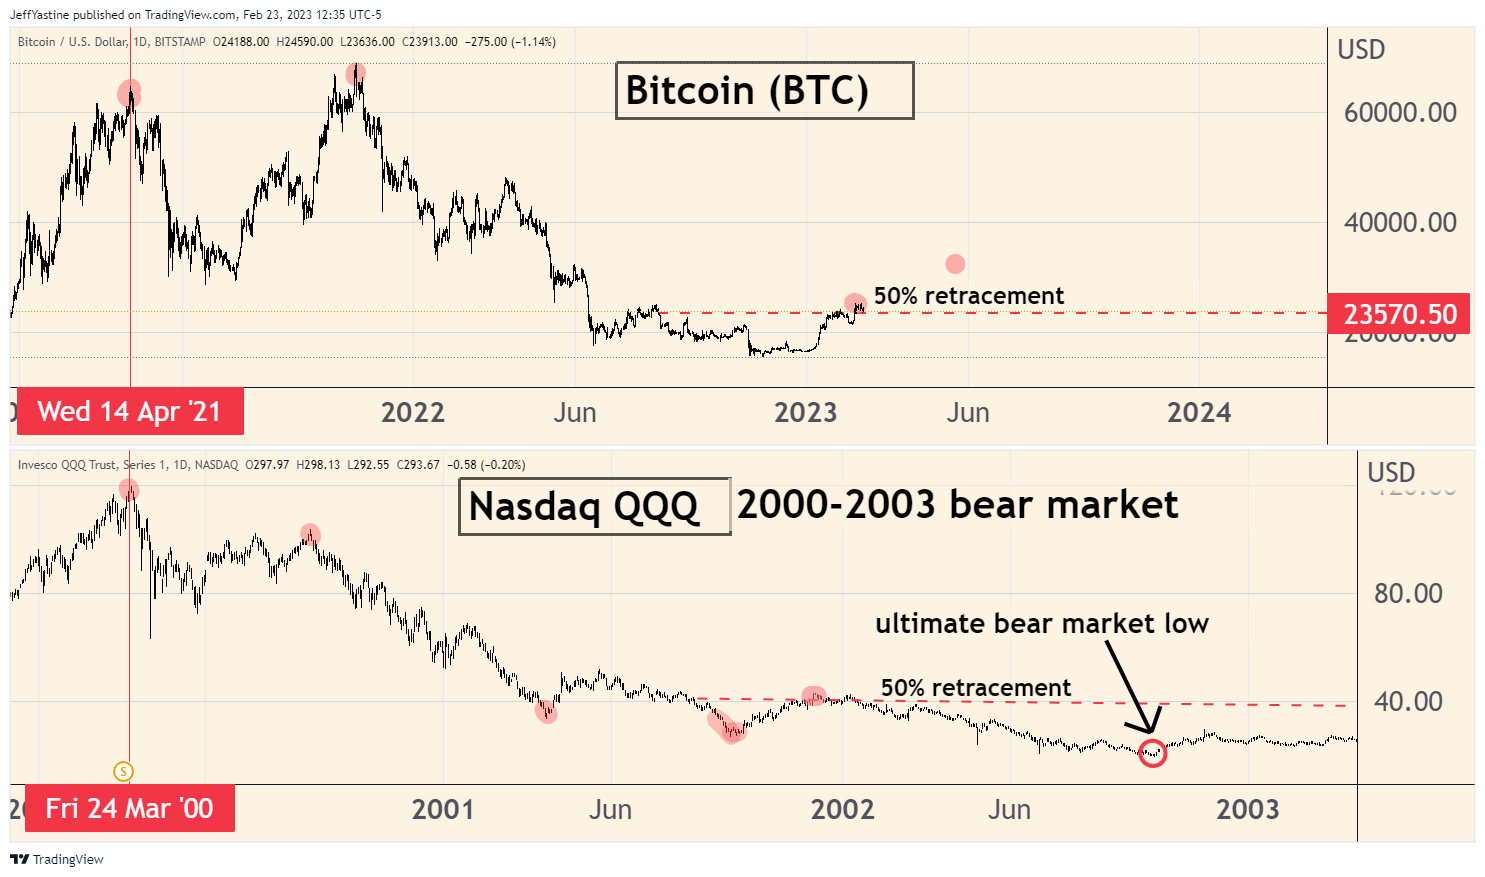
So there you go. Sometimes fundamental analysis explains our world. Sometimes it's better explained by technical analysis.
Jeff Yastine
Member discussion