Market Breakout Ahead?
Well, as we head into the final 2+ weeks of the trading year, things are looking very interesting indeed - for the market, and for yours truly, at home...
First of all, it's not officially "the holidays" in our household until my son and I set up the family train set...
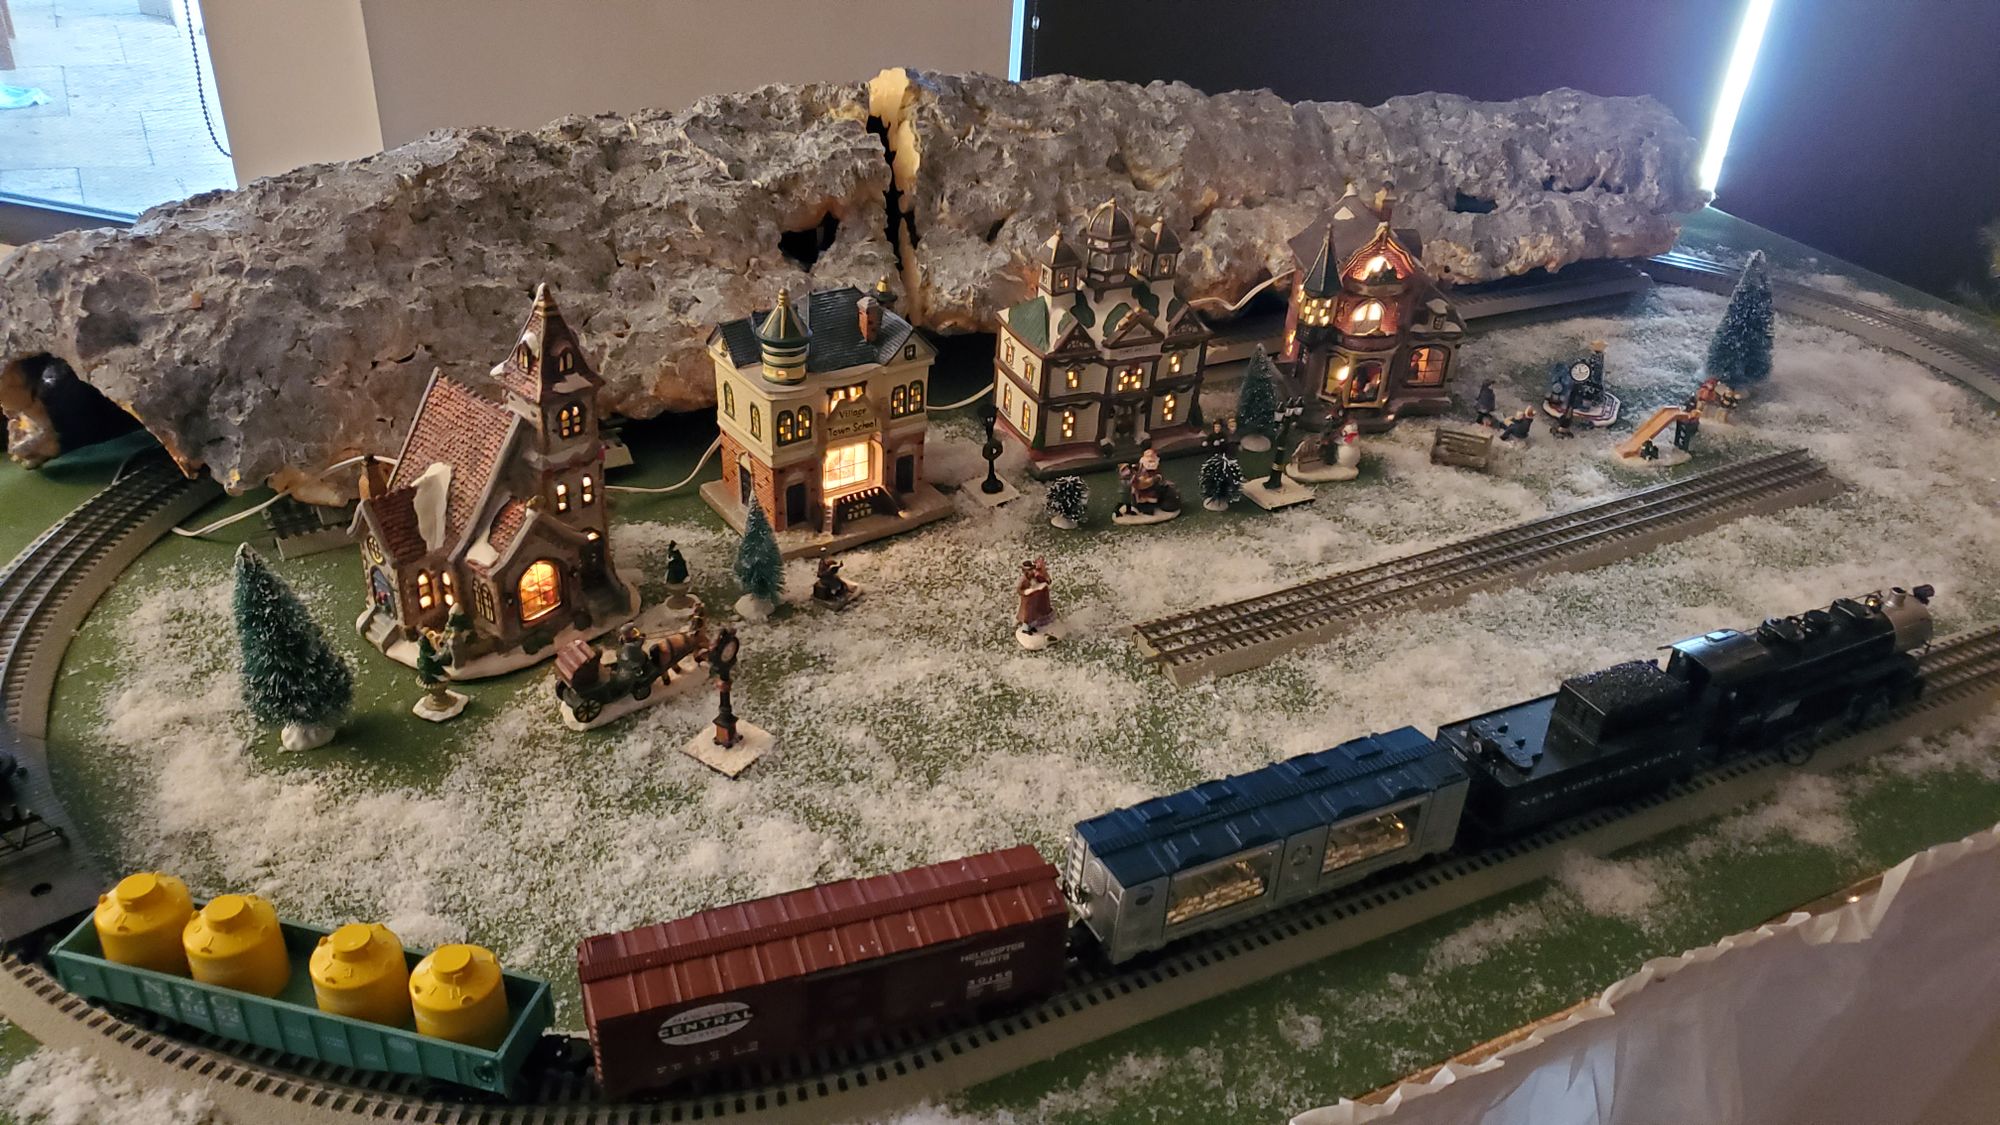
It needs work. We ran out of "snow," which they sell by the bag at the hobby stores. I'll need a lot more to cover the power cord between the buildings.
And I still haven't figured out how to hide the rupture in my DIY tunnel-mountain in the background (constructed some years back from chicken wire and 3 bottles of the "expanding spray foam" sold at the home improvement stores).
Since I'm a stock market guy, this Federal Reserve Bank of Philadelphia "mint car" - a gift from my brother-in-law Paul years ago - completes the picture:
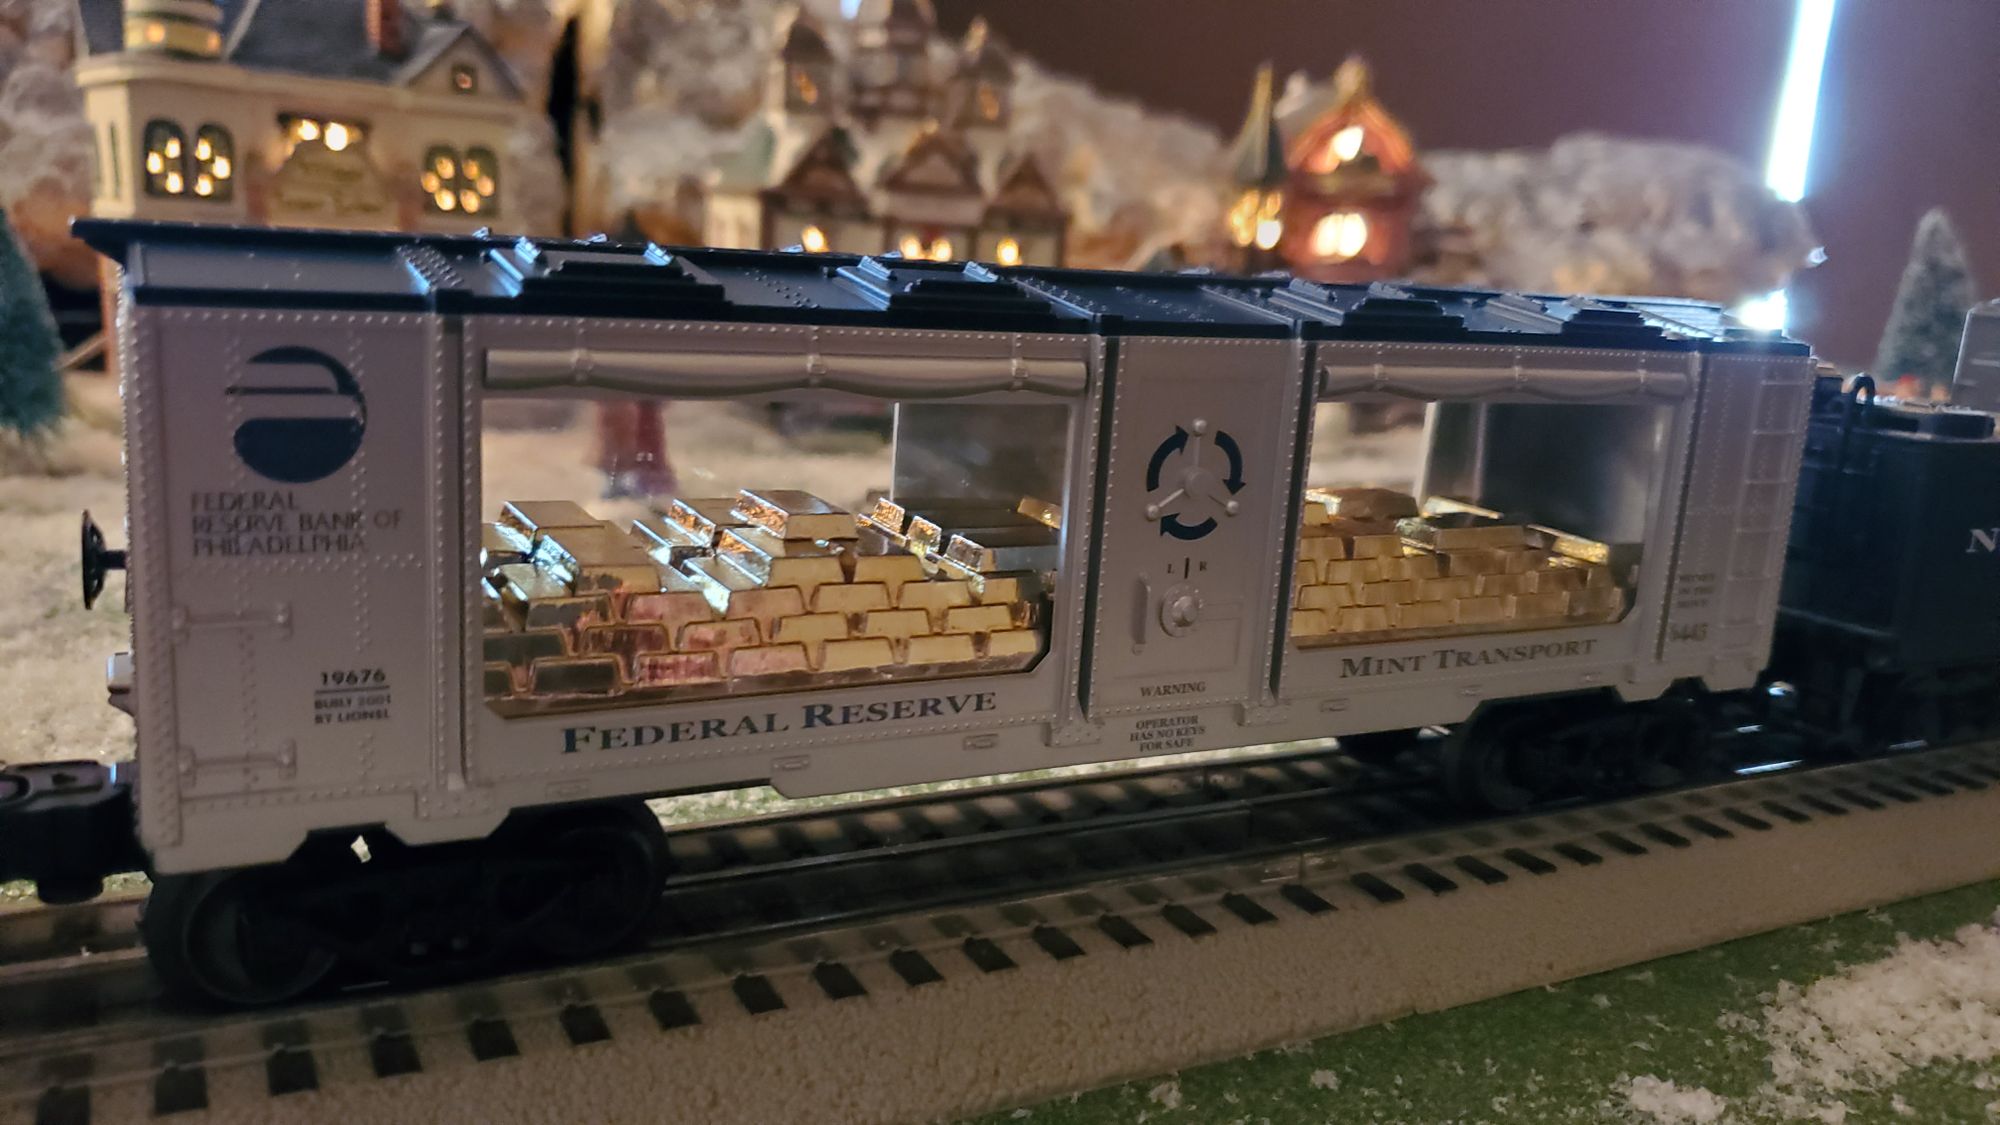
My layout is hardly up to the standards of a model train diehard (my dad was a huge model train buff).
But it's a holiday family ritual to set up, and that's three-quarters of the fun (packing it all into boxes in January...not so much).
But hey, as investors and traders, we have rituals too - like asking ourselves (and everyone else) what the stock market's next move will be?
I'm actually pretty bullish starting off this week.
The key thing I'm watching is the S&P 500 - which finished Friday at a new alltime high (a fact which is curiously absent from most of the financial news headlines).
If we trust what the chart is saying...it's saying that this index and perhaps the other indexes as well...are going to mount a "Santa Claus rally" - or at least be dragged kicking and screaming - to new all-time highs in the coming week.
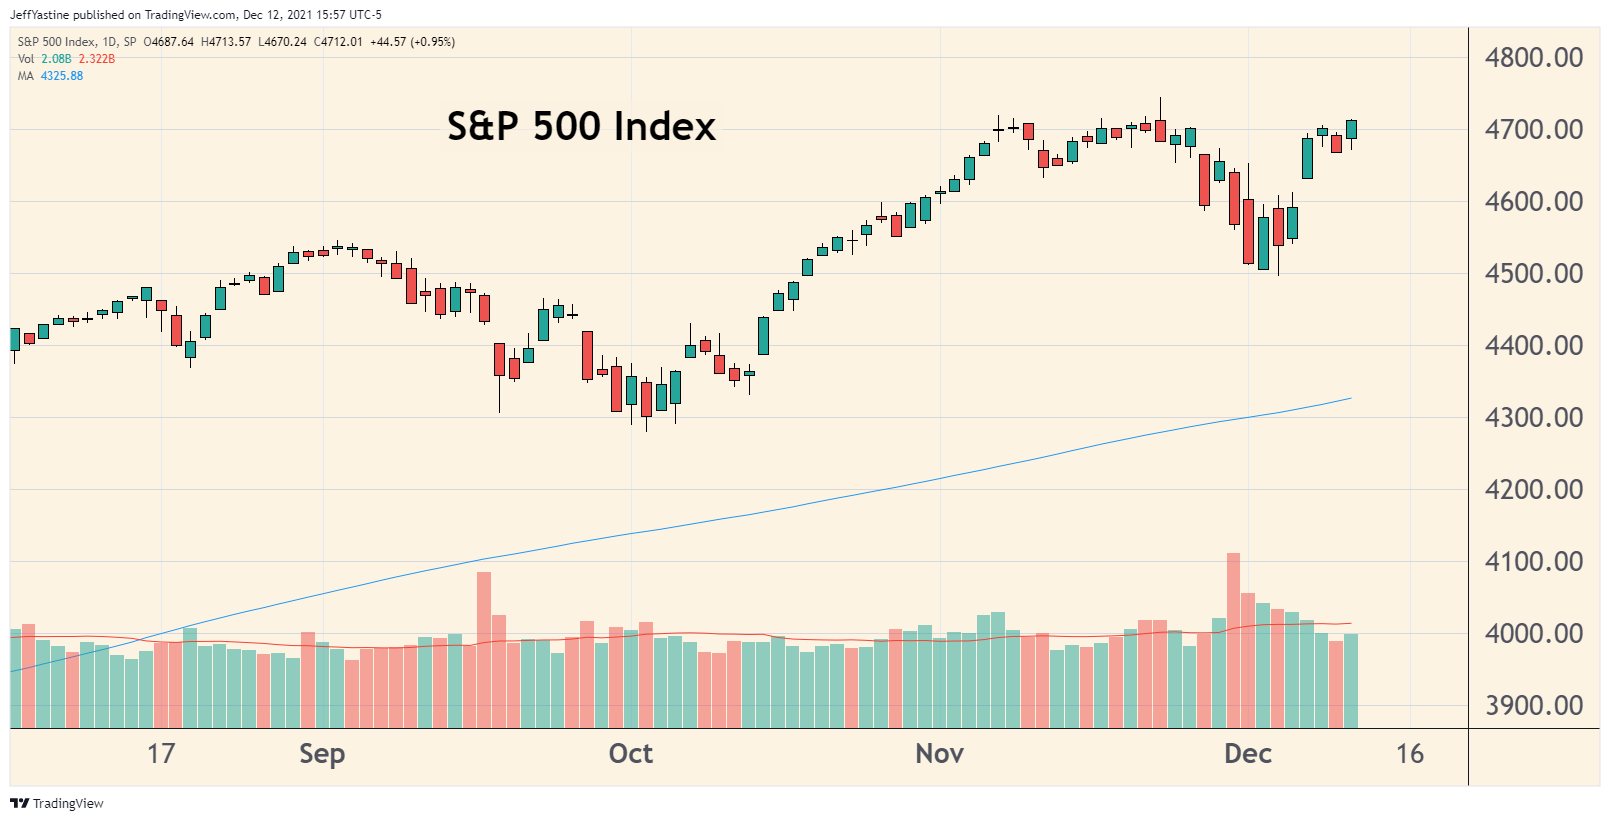
Could it instead be a "breakout fakeout" (meaning it looks like an explosion to new all-time highs, but instead is met by a wave of selling)?
Perhaps. Certainly, the Russell 2000 small caps index paints an uncertain holiday picture. The Nasdaq Composite Index doesn't look all that exciting either:
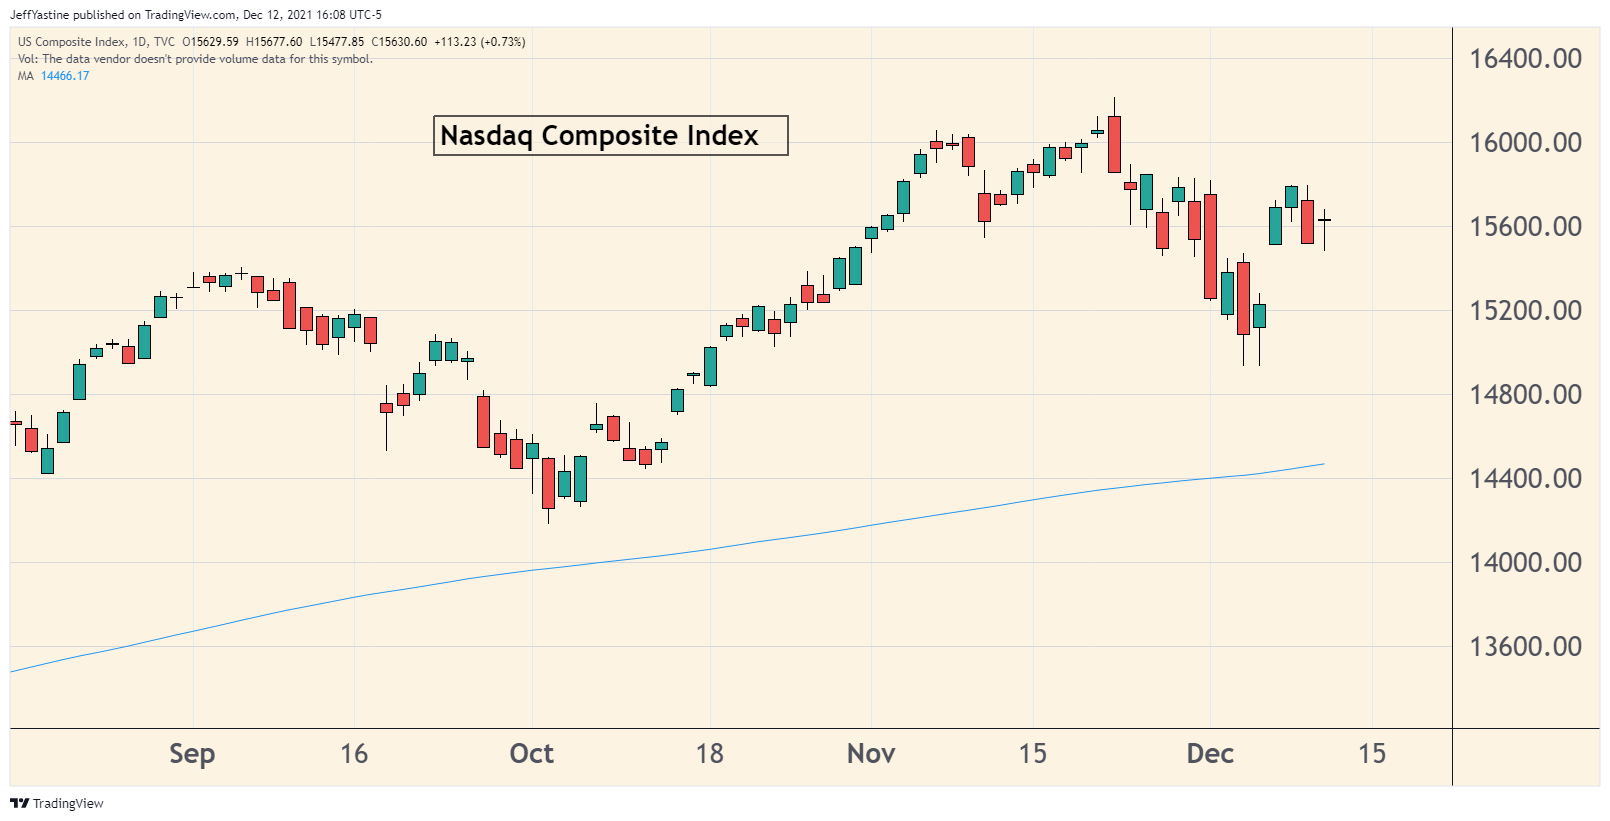
But I've learned the hard way to trust - until proven otherwise - what a major index like the S&P 500 is telling me.
The chart below, which made the rounds on financial social-media late last week, might provide more clues on why it could be better to be bullish than bearish at the moment.
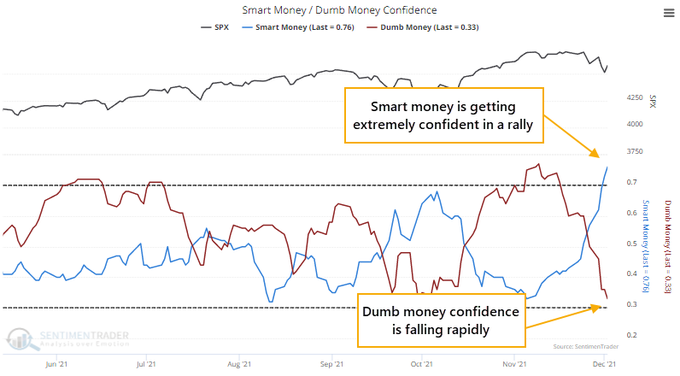
For the record, I don't like the "smart money/dumb money" terms. But the chart is telling us that Wall Street pros are getting increasingly bullish in their outlook, while many regular folks have understandably lost their taste for the stock market lately.
It's easy to feel not-enthusiastic. Omicron is out there. Some metro areas reinstuted mask mandates again. Everyone hates the uncertainty.
But if we go by what the S&P 500 is "saying" - then Wall Street is laying down bets that the omicron variant isn't going to be a big deal.
Keep watching the airline sector for clues. I happened to be bullish on them - that's why I recently put a pair of individual airline stocks in the goodBUYs portfolio (up 3% and 5% respectively).
But as I noted in last week's "chart of the week" the JETS airline industry ETF makes a good proxy and is well worth watching for clues. Here's an updated chart since then:
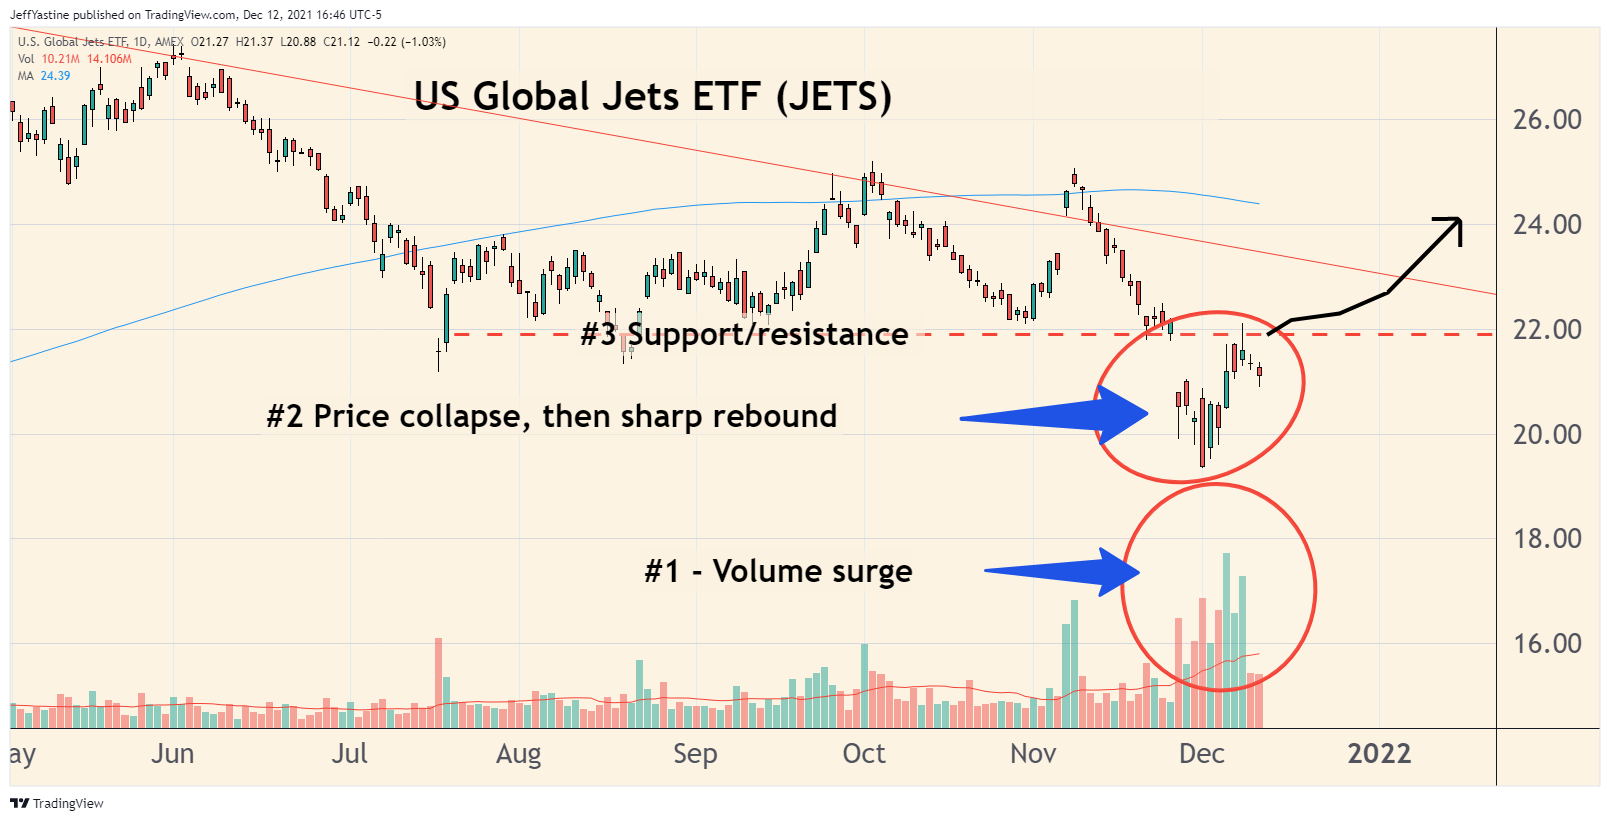
Notice how the airline group ran up into an important resistance level (around $22) and then faded?
That's typical for a down-and-out group like the airlines...they rally into the first major resistance zone where the early "bottom buyers" cash in their profits.
If I'm right about the airlines - and Wall Street is right about Omicron being a more-or-less benign nuisance - we should see the airline group get a second wind in the coming week.
If that's the case, we'll see a lot more than airline stocks heading higher.
Best of goodBUYs,
Jeff
Member discussion