Market Update: It's Darkest Before the Dawn

We're not quite there yet. We're not at a tradeable bottom. But (as I've been saying for about 3 weeks now)...we're close.
My best guess is there's perhaps another 5% to 10% decline awaiting us (more on how I arrived at that guess below).
But if it happens, it will happen really quick - like in just a day, or a handful of days. Maybe even Monday, for all I know.
The main point, as I've been trying to make lately, is that the time to be super-bearish was weeks and months ago...NOT now.
The fact that everyone is becoming very bearish - where there's an expectation of a yet-deeper, longer-term stock market decline which becomes embedded in our thinking - is really a sign of a pending rebound.
And I think the catalyst for that rebound is less than 3 weeks away (more on that below as well).
The Market This Coming Week
Crystal-ball gazing is always a hazardous occupation.
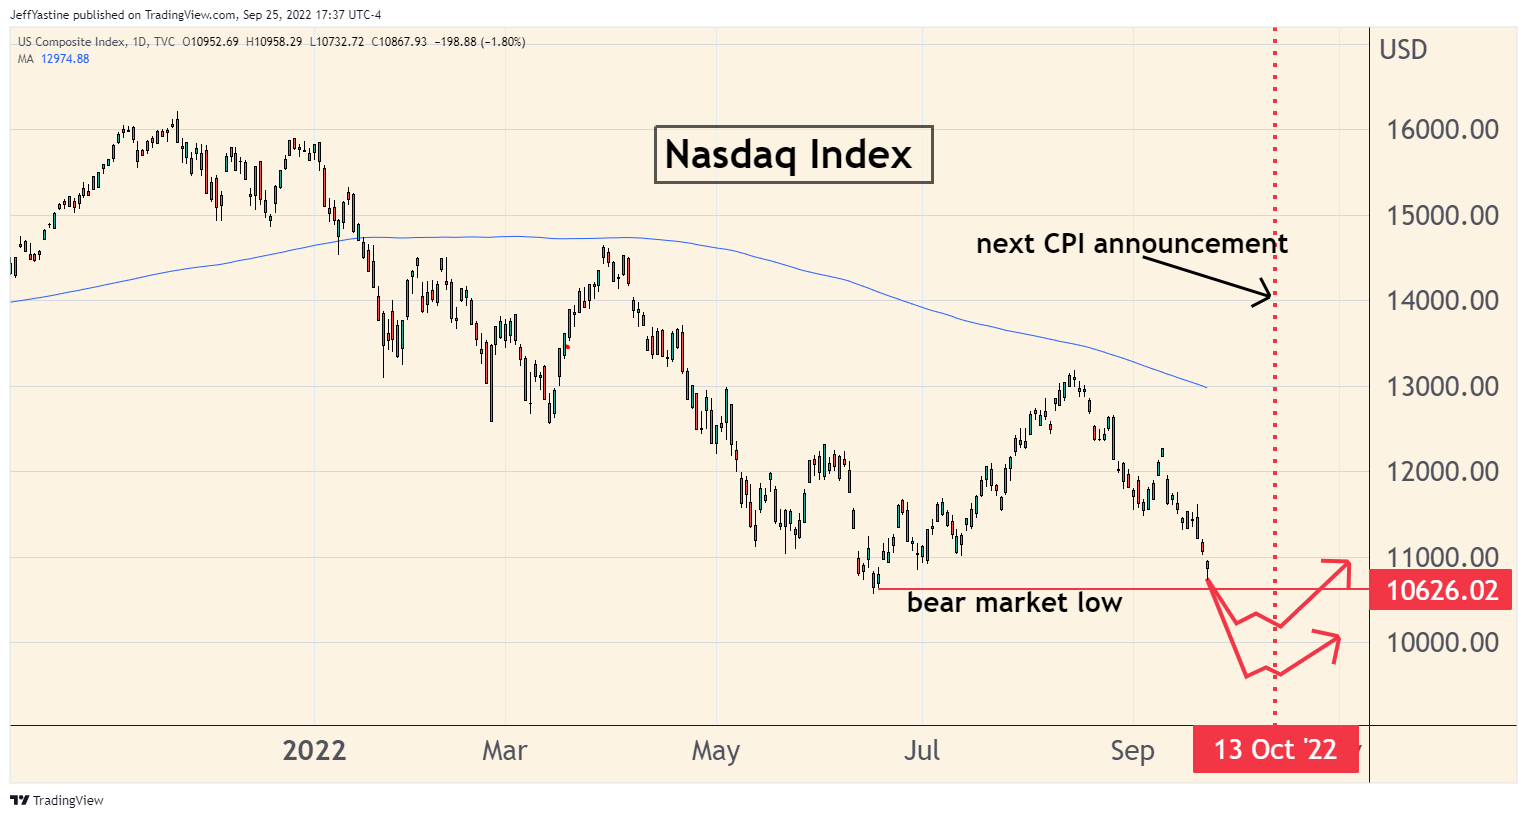
But I'd love to see the market perform what's called an "undercut" low - where it drops below an important support line, like the market's earlier bottom from back in June, and then moves back above it days or weeks later.
That's why I'll be very surprised if we don't see at least nominal new lows tomorrow and in the coming week. The deeper the better as far as I'm concerned.
If anyone wants to see a long-awaited climactic "flush" of the stock market, this would be the week for it to happen - hence my instinct for another 5%-10% decline in coming days.
What if - despite all expectations to the contrary - the market does NOT make a significant new low in coming days?
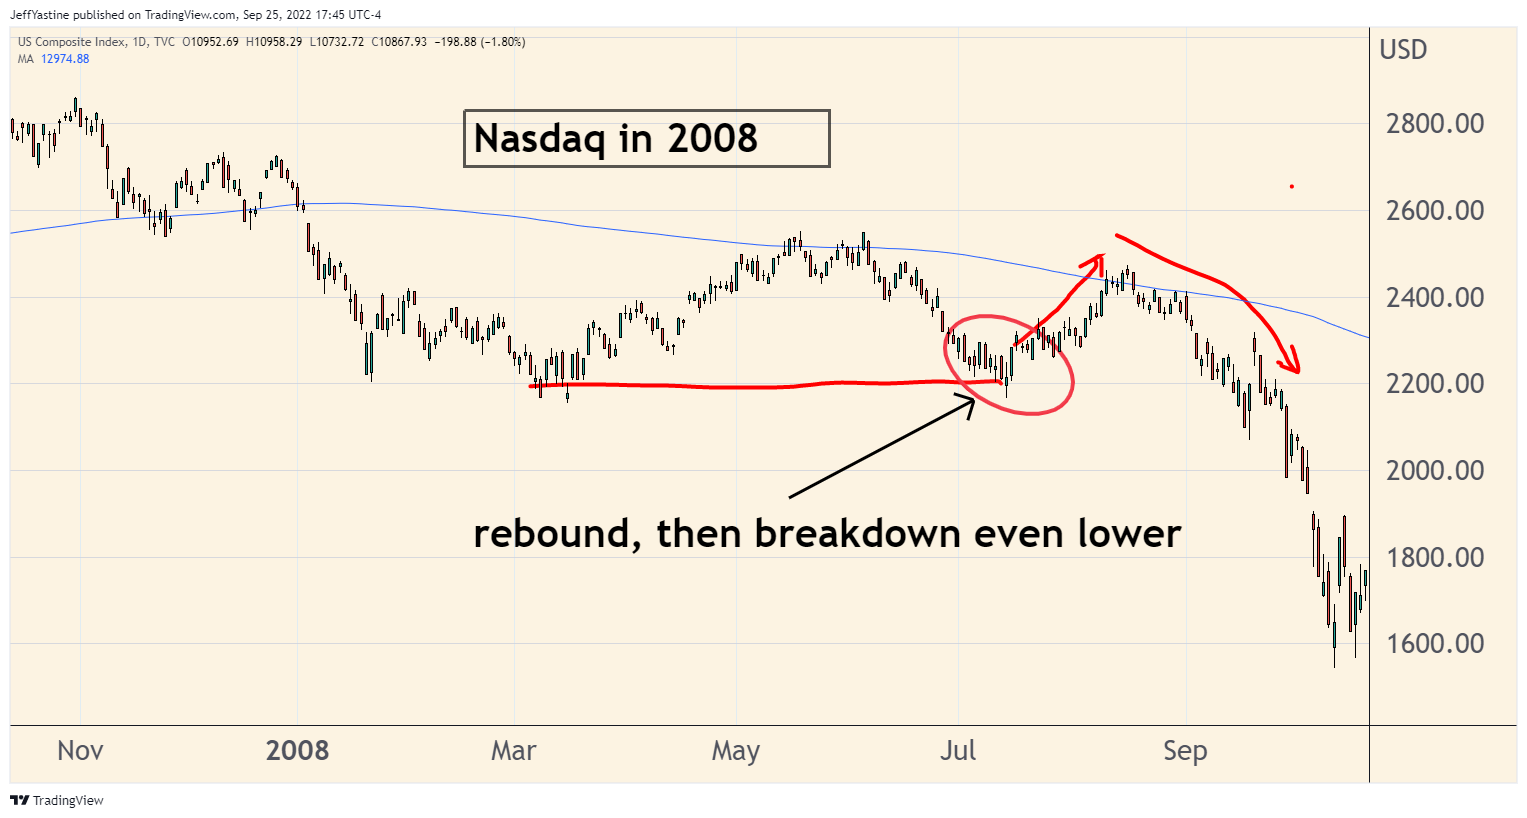
In that case, I'd remain more cautious. The reason is because the Nasdaq did exactly that in the 2007-2009 bear market. In mid-July 2008, the index appeared ready to break down below its prior lows (the flat red line in the chart below). But instead, it broke higher in what became yet another bear market rally before truly collapsing late in 2008 and into 2009:
So we'll have to just watch and see what happens. But I think there's enough fear in the air to drive us to new lows for the year in coming days, and set up a bullish catalyst to drive the market higher once again in October.
So, all other things being equal, how do we know this is NOT the time to become super-bearish and bet on steeper, longer-term declines?
Massive Put Option Purchases
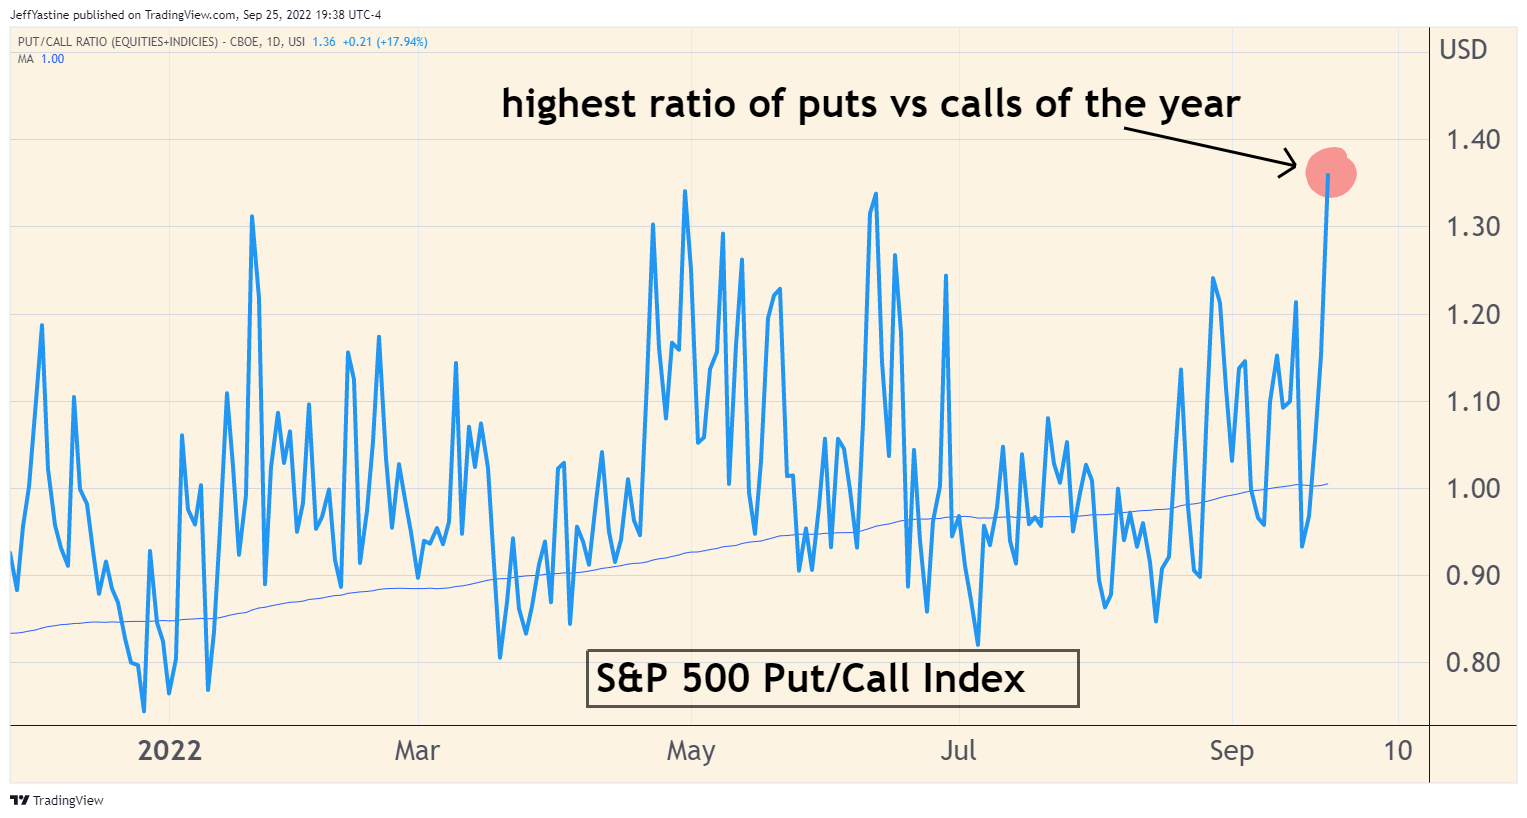
Last week the S&P 500's "put/call index" - the ratio of puts (betting the market will go down) versus calls (betting the market will go up) - rocketed into extreme bearish territory:
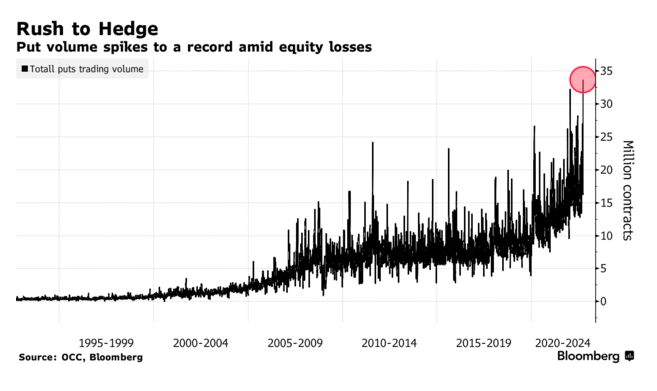
And it's not just the ratio of put purchases, but the volume of put purchases - what we'll call folks buying "portfolio protection" that was also off the charts last week:
When put-purchasing becomes this popular - with the market about to hit new lows...well, I equate it to last year's Super Bowl commercials when Matt Damon was telling 100 million+ viewers to buy cryptocurrencies because "fortune favors the brave."
That was an anecdotal sign of a top in speculative assets.
An anecdotal sign of a pending bottom? Massive, massive put buying.
Stocks No Longer Popular with US Households
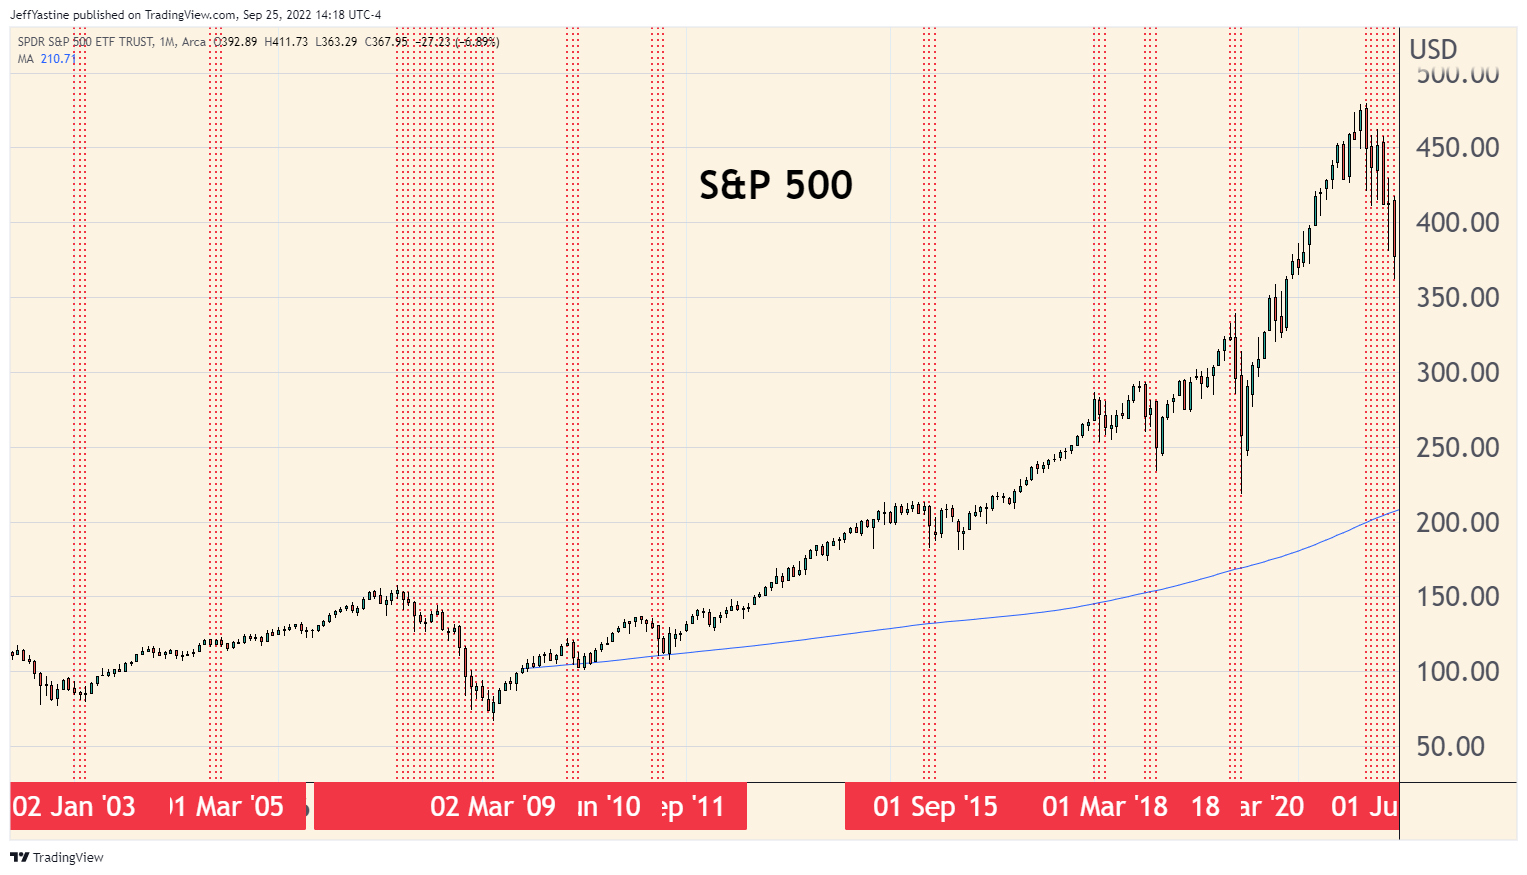
Here's another bit of data pointing in the direction of a pending bottom...the percentage of average household assets allocated to equities (stocks) versus other asset categories like bonds or real estate.
The Federal Reserve has been tracking this stuff for more than 70 years. If you just highlight the quarters where US households are net-sellers of stocks (the red lines in the chart below), you can see how it might be useful to spot potential bottoms in the stock market:
Turns out some very smart market market researchers have been doing just that, and noticed certain correlations. [Please note that the Fed's data only comes out at the end of each quarter. So it doesn't help us with predictive market timing - the data has too much of a lag in it].
But as Marketwatch's Mark Hulbert (one of my favorite data-based financial contributors) recently noted:
"As of midyear, this indicator [percentage of households allocated to stocks] stood at 44.8%, down from 51.7% at the end of last year.
At the lows of the seven bear markets of the last 25 years in the calendar maintained by Ned Davis Research, the indicator averaged 37.1%."
If the "households equity allocation" indicator was 44.8% at midyear, it's likely even lower now - and perhaps at or below the average 37.1% threshold of a "bear market bottom" mentioned above.
That's yet another reason why I think it's a reasonable bet to think we could see a stock market rebound sooner than many expect.
Rebound Catalyst?
I think the rebound catalyst will be the October 13 release of the Consumer Price Index (CPI) for the month of September.
As I noted after the August CPI report came out a few weeks ago, Wall Street was focused on the component numbers. The main news - that the overall inflation rate had peaked in June at 9%, and since fallen to 8.5% in July and 8.3% in August - was completely ignored.
Personally, I think Wall Street strategists just weren't ready to embrace the idea that inflation had peaked. With the upcoming Fed meeting, they wanted the market to fall further. The narrative of "stronger-inflation-than-expected" after the latest CPI report was a good narrative to push the market still lower.
Collapsing Inflation Expectations
If we want further confirmation the inflation trend is in the rear-view mirror, we can find more evidence in a closely watched indicator of near-term inflation expectations.
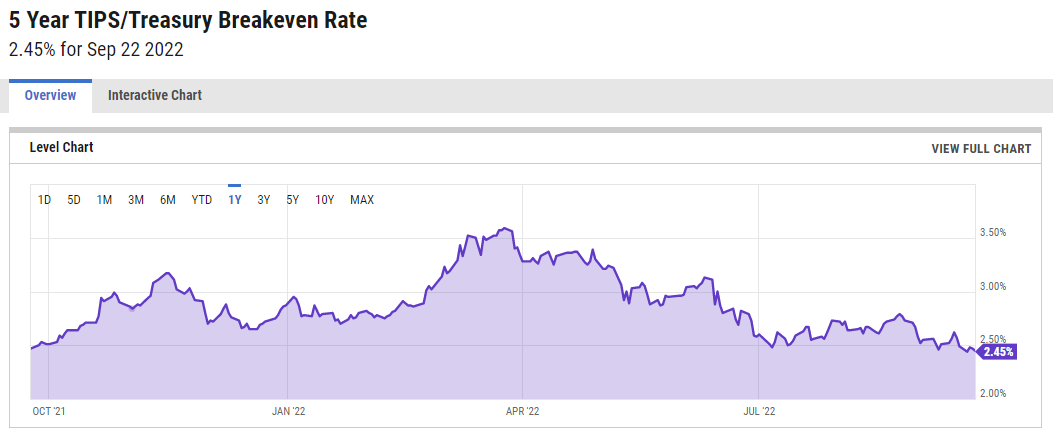
It's called the TIPS/Treasury Breakeven Rate.
Basically, it's the mathematical difference of taking the yield on a 5-year "TIPS" - Treasury Inflation-Protected Security (which is indexed to the CPI to compensate investors from the inflationary-loss of purchasing power) and then subtracting it from the yield on a plain-jane 5-year Treasury bond.
As you can see in the chart below, near-term inflation expectations peaked earlier this year and have been dropping ever since:
Personally, I think when the most recent CPI came out a few weeks ago, Wall Street strategists just weren't ready to embrace the idea that inflation had peaked. With the upcoming Fed meeting, they wanted the market to fall further and "stronger-inflation-than-expected" was a good narrative to make that happen.
With the market now down 10% lower - and likely to drop still more in the next few weeks - don't be surprised if the same Wall Street strategists find a lot to like in the October 13 CPI report, compared to the one that came out on September 13.
I'll continue to monitor the market and send updates and observations as needed.
Jeff
Member discussion