Stock Market Bottom? This is What It Feels Like...

After Friday's wipeout, it's easy to conclude that the market is telling us to run - don't walk - away from stocks.
But my instinct is saying "hold on, not so fast."
I'm no perma-bull. But as a former financial journalist, and veteran trader and investor, I've seen it happen many times. I've fallen pray to it myself...
There comes a moment when we all throw up our hands and say whatever. It's all a conspiracy. The little guy doesn't stand a chance. The market is going to get crushed from here on. The Fed is going to kill this market and I'm getting out. Case closed.
(Last Friday, and the market's negative reaction to the September employment report, was one of those days.)
But then days, or a few weeks after Wall Street's PhD-titled macro economic forecasters have convinced all of us to abandon the market and jump into the abyss, some of them start to change their minds just a little bit.
Their commentary goes something like this:
"Well, maybe things don't look quite as terrible as we thought. Maybe the market already reflects the worst possible news. And you know what? We're not bullish exactly, but we're constructive about the market."
And the rest of us think..."Hah? I just got out of the market and now Mr. Wall Street Strategist is telling me things aren't as bad as he thought?
It's one of the reasons I don't trust macro-economic forecasters. Their data always sounds slick, with a million reasons why it's completely obvious that they're right. Yet their predictions and calls are as wrong as anyone.
So in the coming week - where we'll get important inflation trend data with the release of the September CPI this Thursday - keep that thought about macro-forecasting in mind.
Maybe the Federal Reserve is going to drive the economy off a cliff. Maybe the stock market is going to collapse from here, like it did in 2008. We always have to consider and stay prepared for the worst-case risks.
But you'll forgive me if I say...it all seems too easy. Too simple. Too negative.
Clues in the Charts?
For example, the market certainly looked terrible on Friday, didn't it?
And yet the market - both the S&P 500 and Nasdaq - actually closed higher last week.
Can you believe that? Check out the chart below where each "candle" represents one week's worth of S&P 500 data. I've circled it in red so you can see it more clearly...
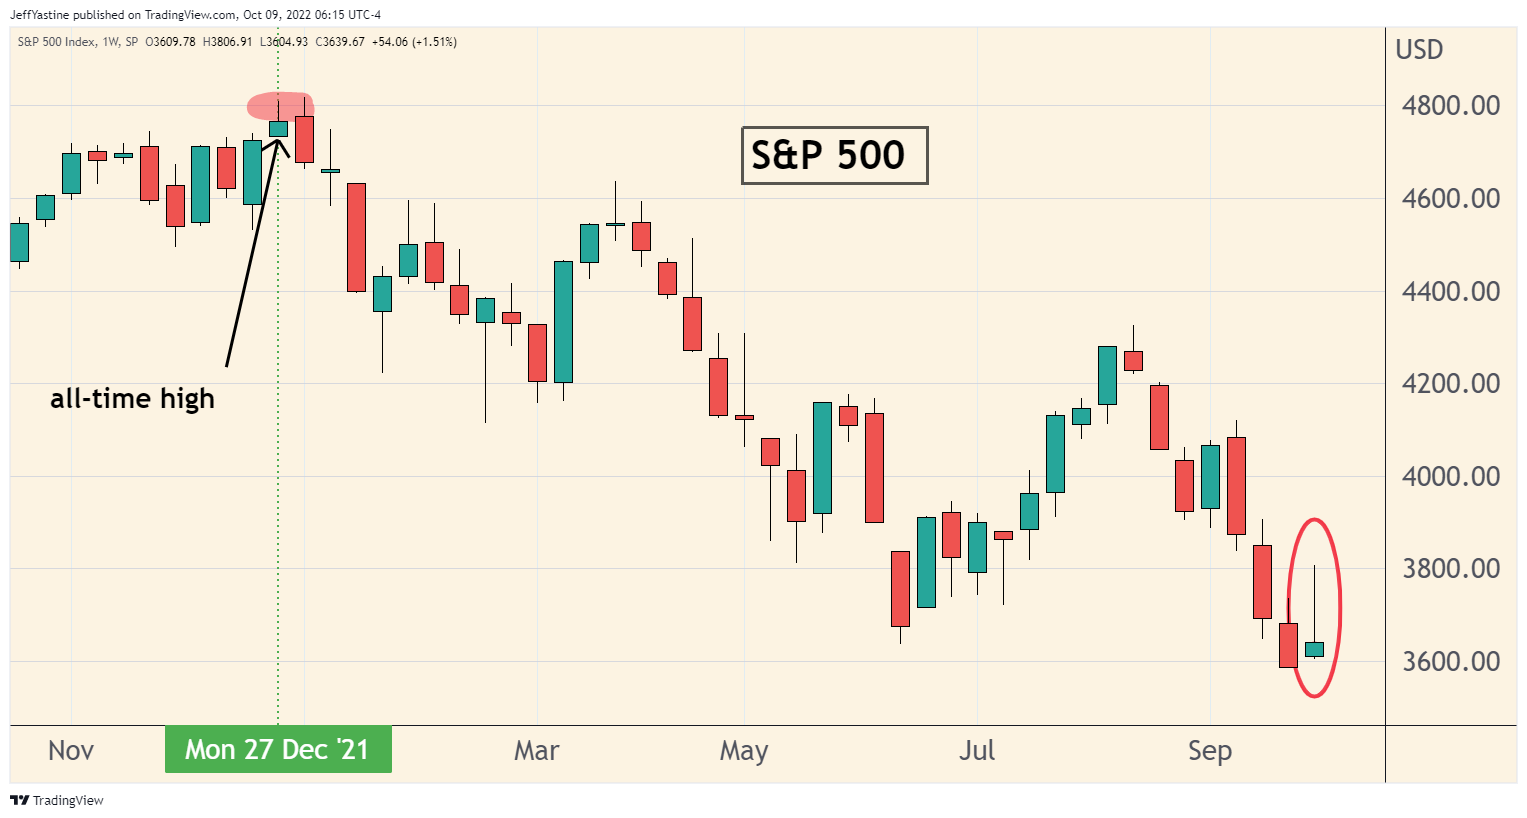
In so-called 'candlestick' charts like the one above, last week's formation is known as a bullish 'inverted hammer.'
When seen after a long downtrend, an 'inverted hammer' is considered bullish because it demonstrates that a stock (or in this case, the market itself) had every reason to sink to new lows, always a bearish sign - but instead, stopped just short of collapsing - and finished higher.
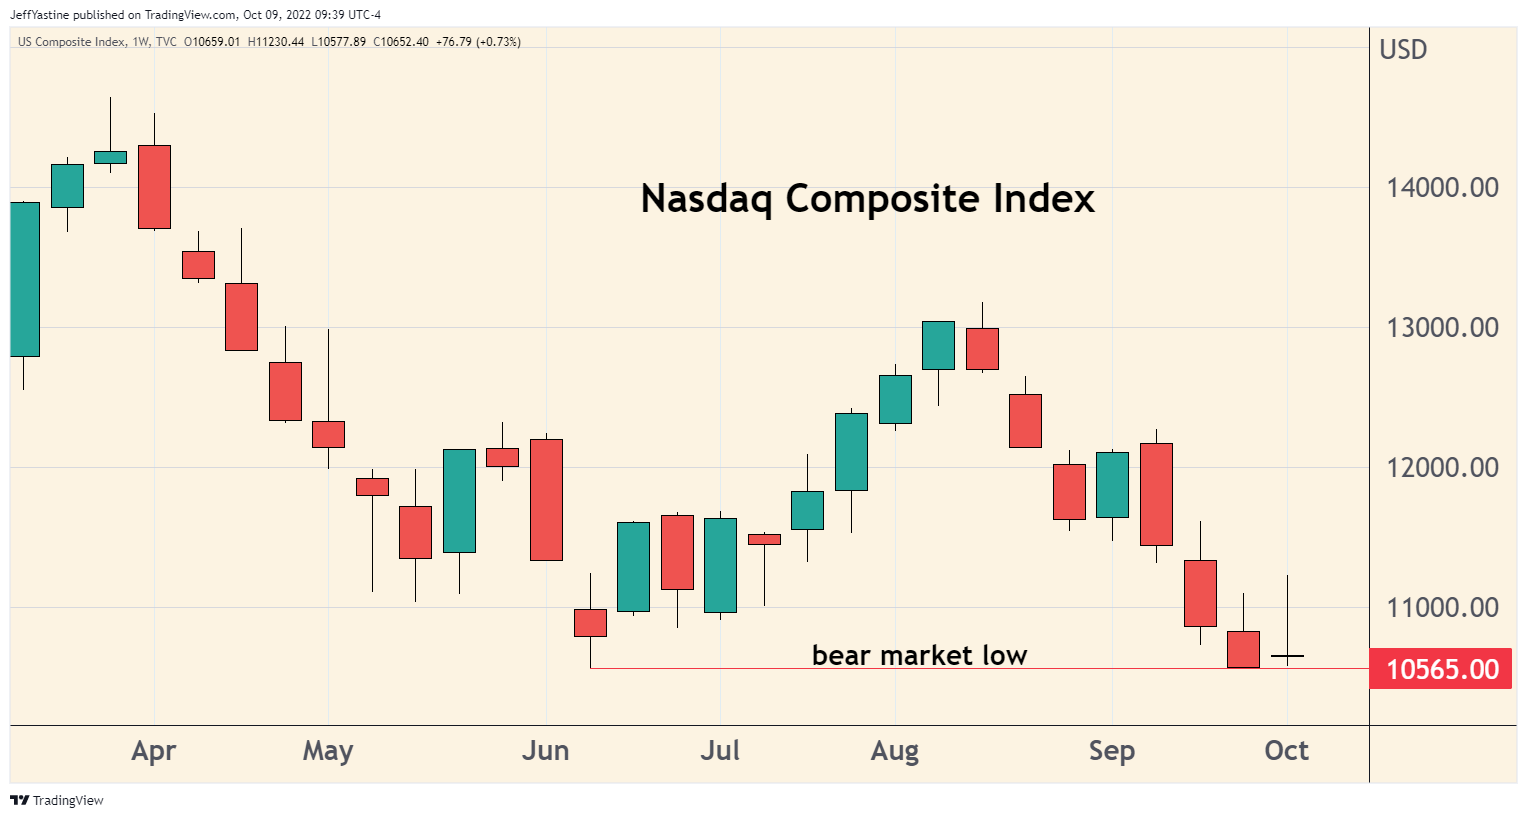
The Nasdaq is similar - but even more bullish, considering the massive sentiment pressure to "sell everything" - in that the index has yet to new a new weekly low since touching 10,565 back in mid-June:
The coming week could see more such attempts to push the Nasdaq and S&P 500 past prior lowers. (Remember that we have important inflation data coming out on Thursday with the release of the September CPI report).
But if we finish next Friday at or above present levels...it's another clue the market may be putting in a bottom while we're all looking the other way.
Other bullish technical tidbits...
One way we gauge how the market is doing - or where it might be going in the future - is by comparing it to other kinds of yardsticks.
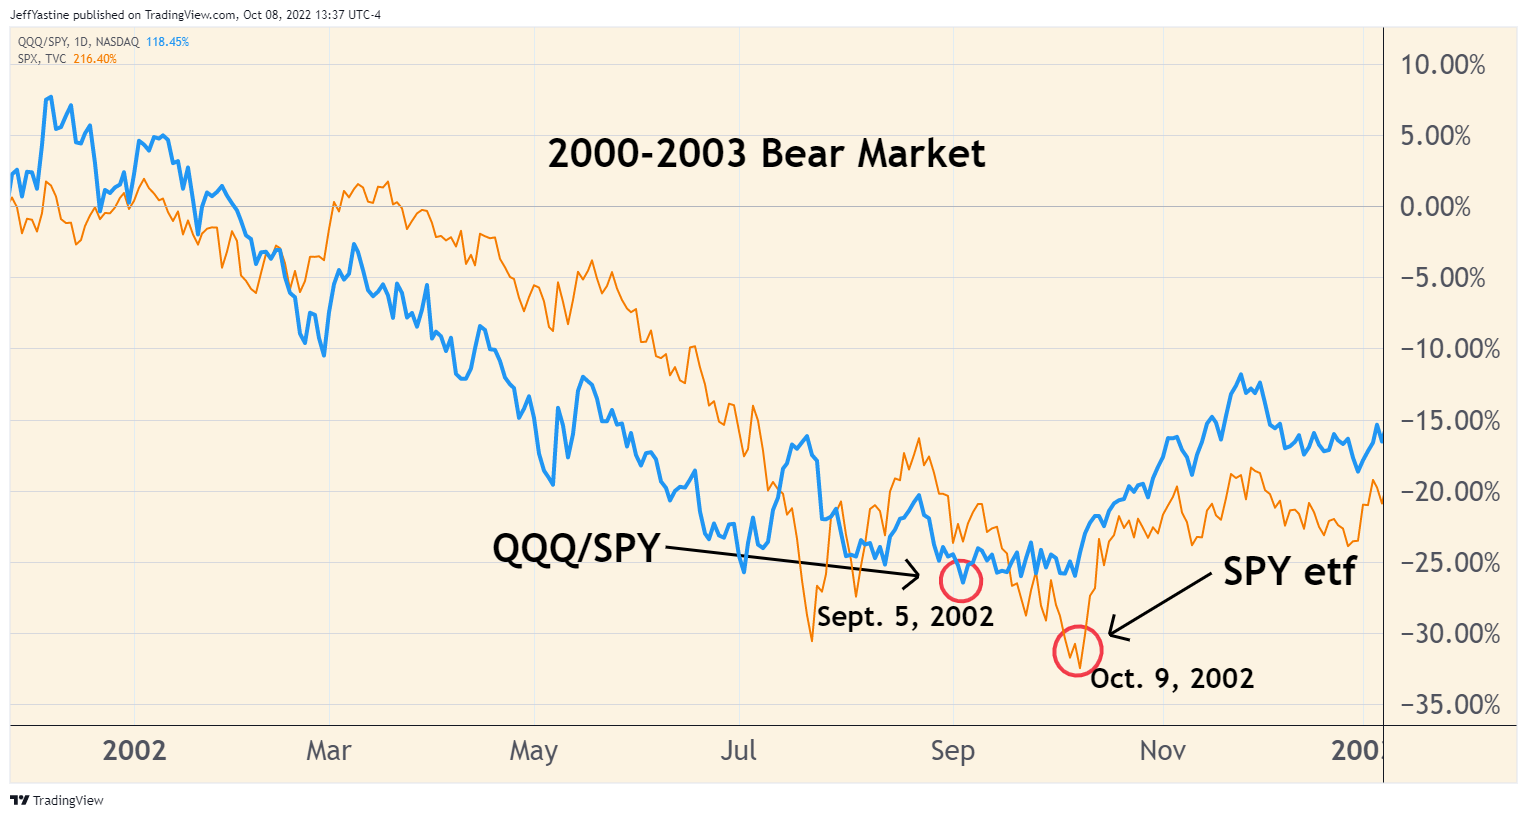
For instance, if we divide the Nasdaq's QQQ by the S&P 500's SPY, it gives us a simple ratio. It shows us when the faster-growing "tech" part of the economy is out-performing the industrial part of the economy reflected in the S&P 500.
Starting with the 2000-2003 bear market, some technical analysts have noticed that when this ratio bottoms out...the S&P 500 tends to bottom out about 1 to 4 months later (wait for the last chart, showing 2022!):
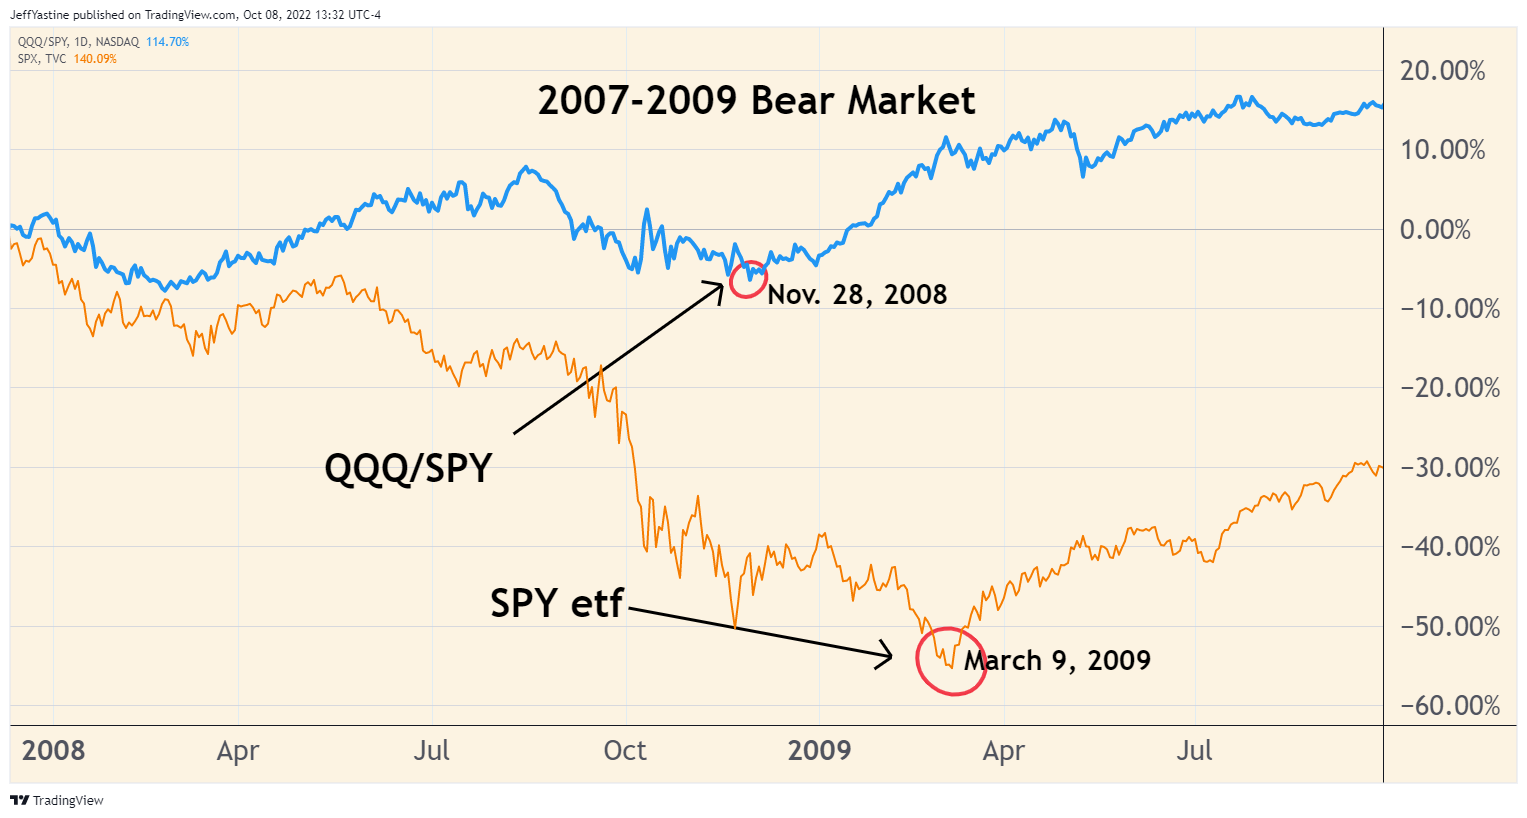
Something similar happened again in the 2007-2009 bear market...
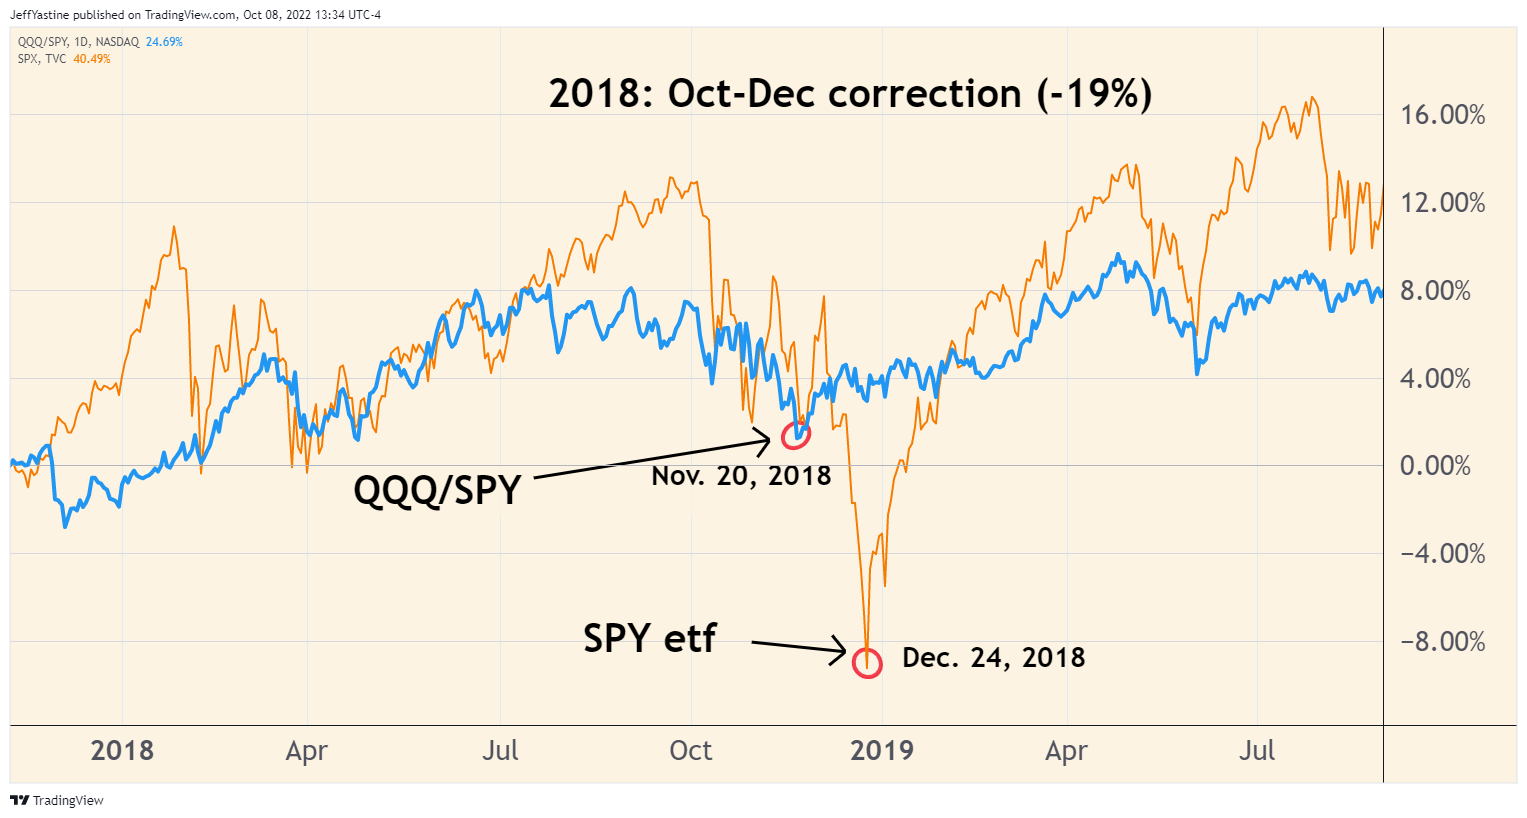
And again in the 2018 almost-bear market...
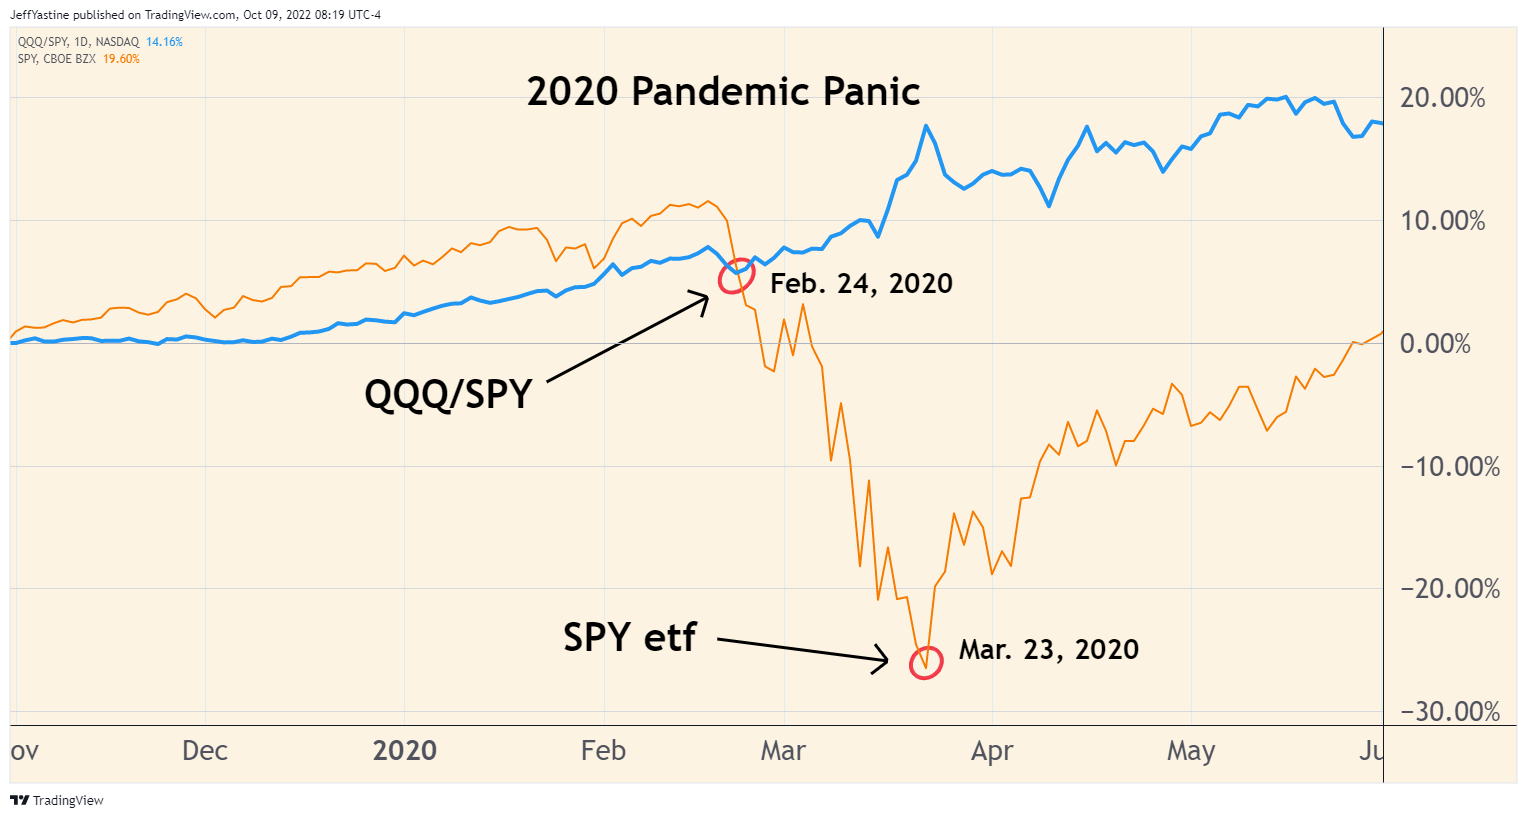
During the brief but violent 2020 bear market...tech stocks barely flinched, despite the massive selloff in the overall S&P 500:
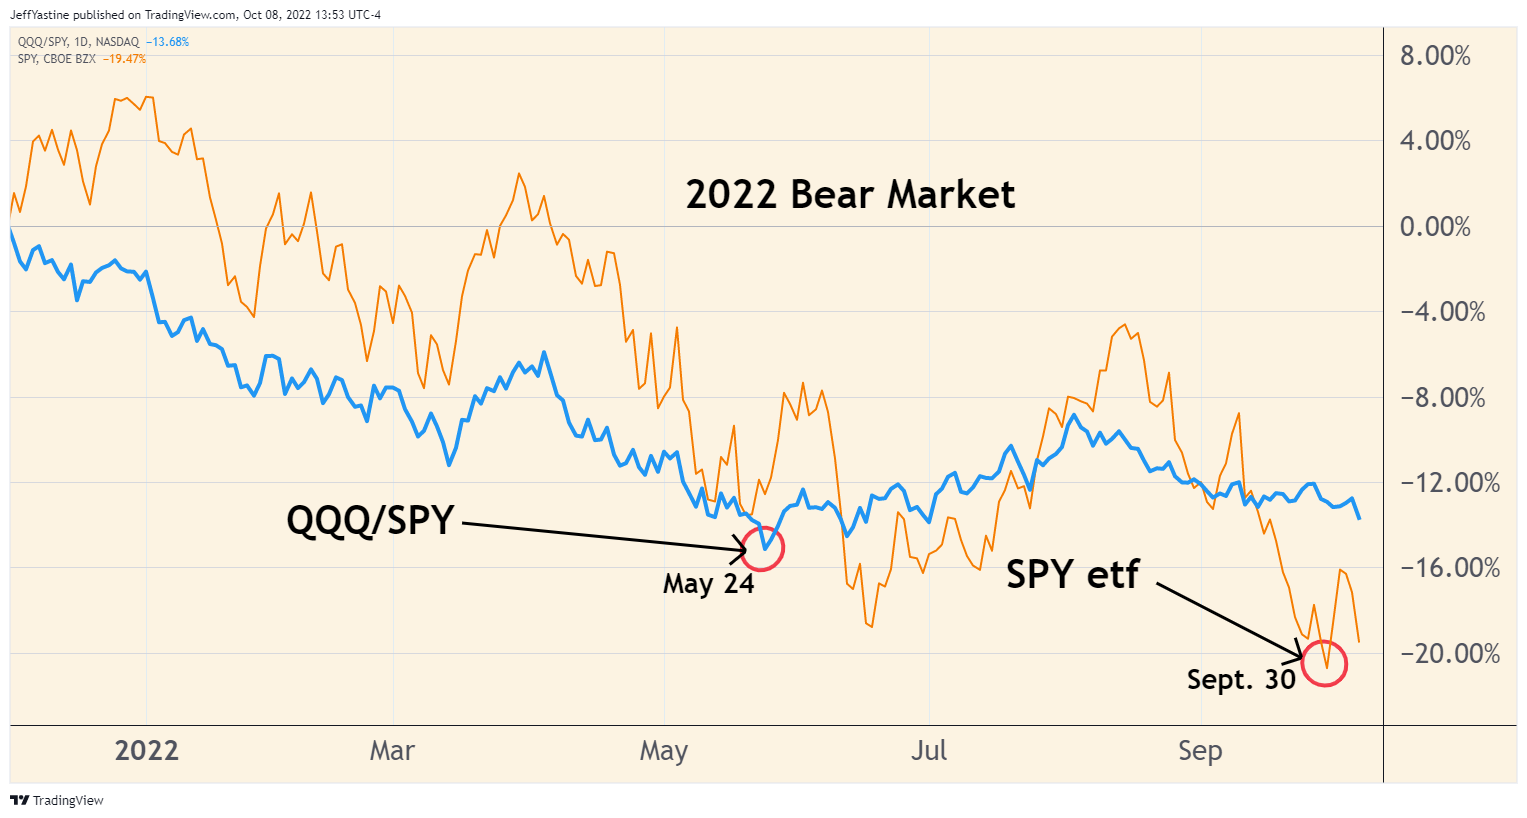
And here in 2022...the QQQ/SPY ratio bottomed in late May and (at least so far) has not made a new low...
No Recession?
Another reason I don't trust macro-economic forecasters...has to do with this Marketwatch headline, which caught my attention last week:
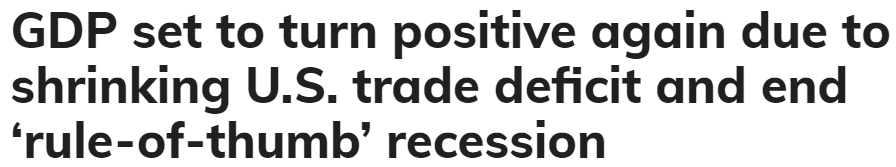
Think about the headline...summarized as "GDP is set to turn positive....and end recession"
I mean, what? We've all been told that "a recession is coming." That's one of the reasons why everyone is running away from the stock market. And yet, that argument is hardly cut-and-dried take-it-to-the-bank truth.
The article notes that the US may have slipped into a recession last spring. And it may be in the process of exiting the same recession now.
If that has you scratching your head about what constitutes a "recession," just remember...
US economic recessions aren't "official" until a group of economists (they're called the NBER - National Bureau of Economic Research) declare that one has happened. The NBER folks meet in secret and compare notes. Their declarations sometimes come out months after-the-fact.
In other words, by the time they get around to saying "Yes, we just experienced a recession"....the stock market has already discounted that possibility and moved on.
I think that could well be the case now.
What about the Fed? The central bank wants to continue raising interest rates very aggressively. High rates are always bad for the stock market, right?
Wrong. In the stock market's long history, it's gone through all combinations of up, down, and sideways while the Fed raised interest rates. Yes, the market is going down now. But there's no guaranteed 100% rule that says it must keep going down until the Fed says "OK, we're done raising interest rates."
As I'll note again...we'll get a good look at inflation trend data this Thursday, October 13th.
If it shows yet another decline in the overall rate of inflation, the market may well decide that the worst is past - even while Wall Street's "macro guys" are still convinced the bear market still has a long way to run.
Jeff Yastine
Member discussion