Chart of the Week: Oil Price Reversal?
Last Friday, I wrote to you that "there's perhaps a 70% chance that we're looking at a near-term top in oil prices in coming days"...
If I'm right, the top in oil prices might've been Friday, Monday and today - both of which saw rallies up to $95 a barrel - and then steep selloffs the last 2 sessions, as traders hastily sold their positions:
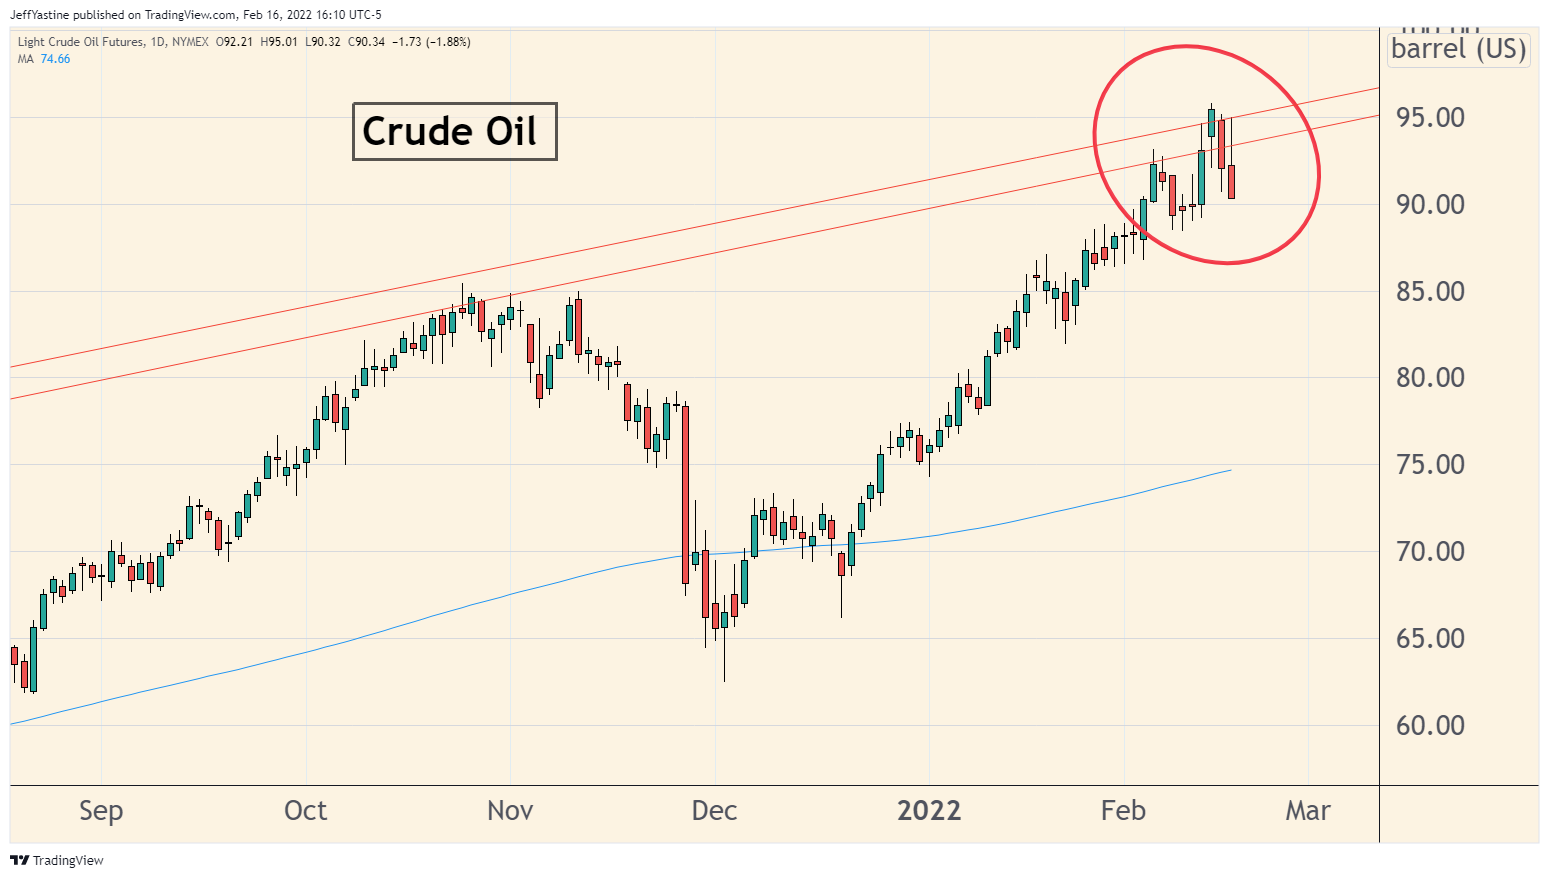
What makes it all the more interesting - the last few days of weakness are happening at a technical resistance level on the charts. Each time oil has run into this resistance level, we've seen a decline on average of 17% in following weeks:
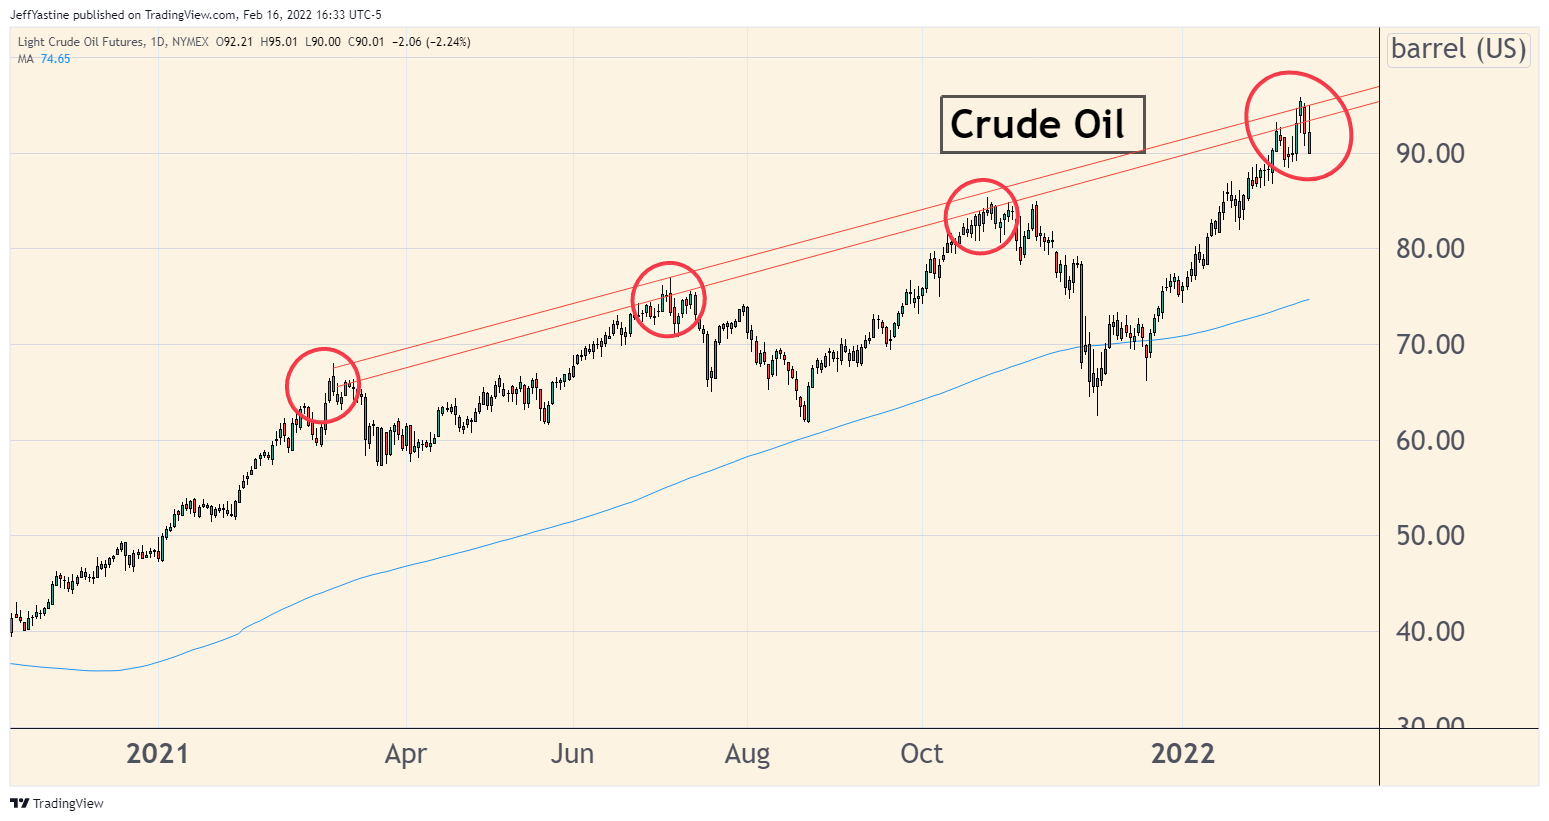
What's the big deal about that?
If oil prices begin to fade lower in coming days, it takes the pressure off the Federal Reserve to raise interest rates quite so much over the coming year.
It also helps break the narrative - common among bearish investors these days - about runaway inflation causing a cascade of worries, and lower prices, for the stock market and the economy in general.
Yes, we still have the confusing Russia-Ukraine situation to deal with.
Supposedly Putin was going to pull some of his troops off the border yesterday. Today, NATO and US intelligence sources say there's no evidence that it's happened.
On the other hand, today - Wednesday - was supposed to be "the day" when an invasion would get going - and nothing happened either.
If oil prices keep sagging from here in coming days, the stock market is sure to take positive notice.
PS - I did a whole video on Monday regarding the possibility of an "Oil Price Peak" - feel free to check it out and become one of my subscribers on my YouTube channel as well:

Best of goodBUYs,
Jeff Yastine
Member discussion